A Kasa Smart Plug Collector and Grafana dashboarding project.
Available Dashboards
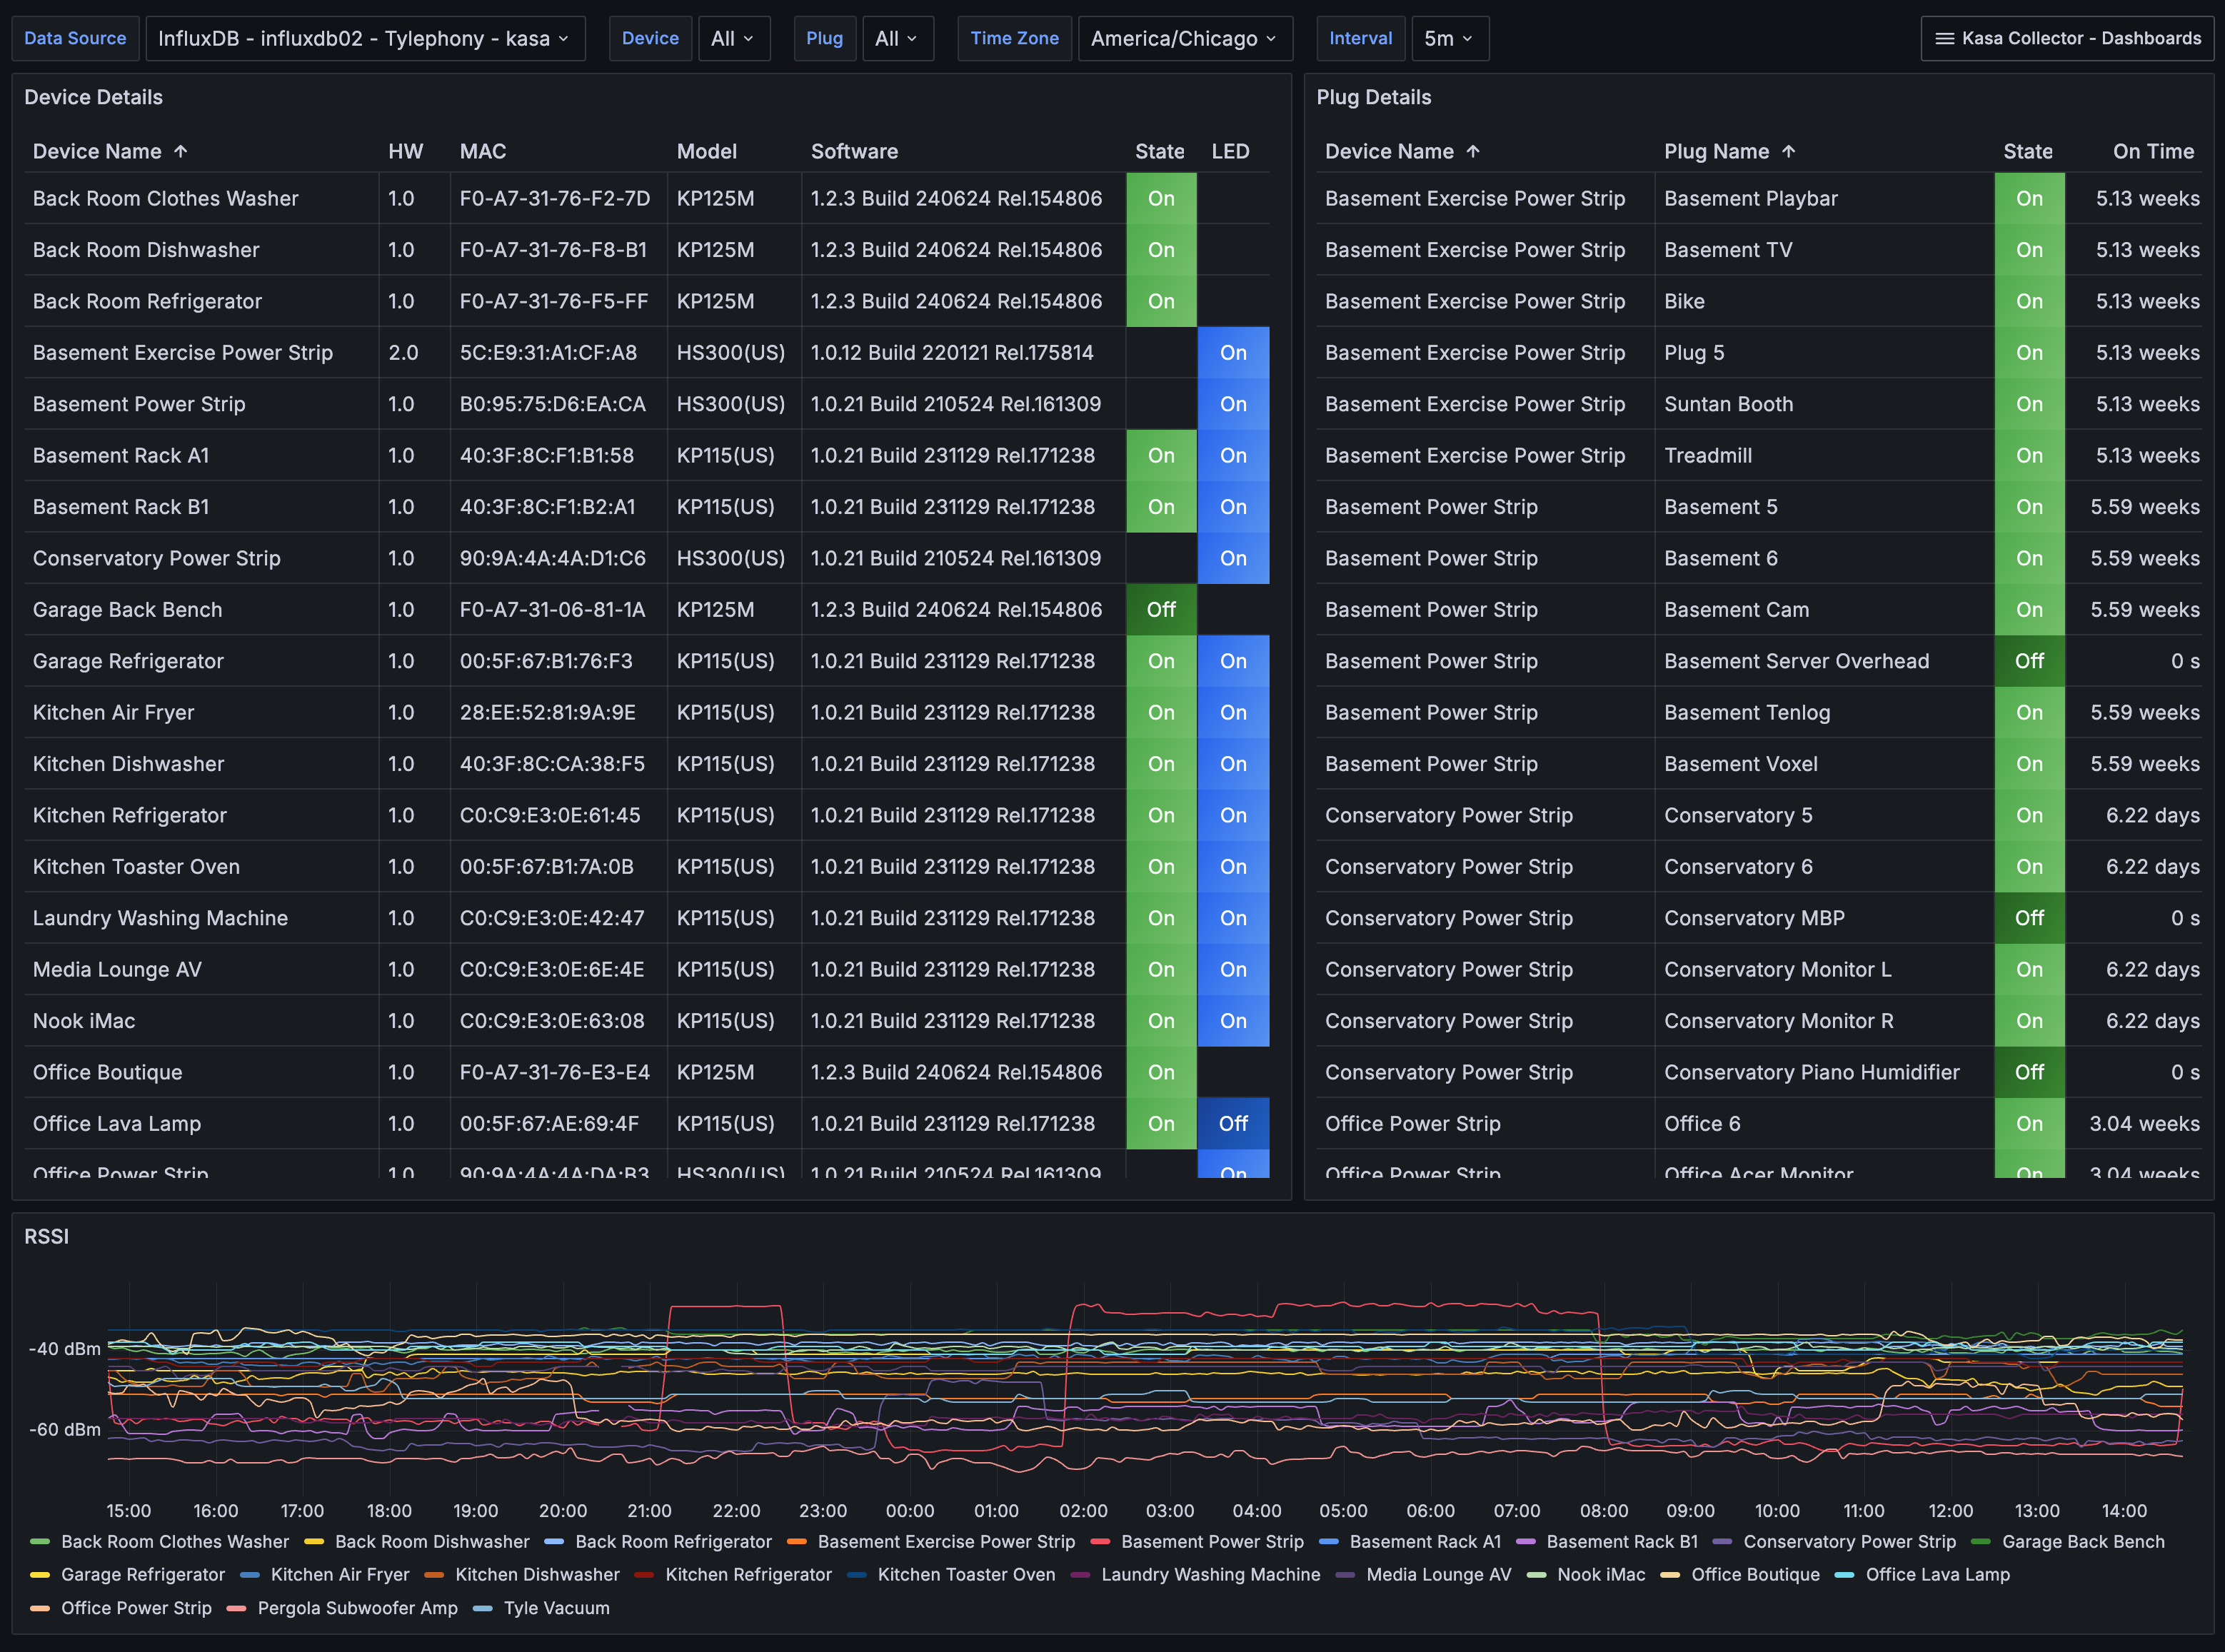
Kasa Collector – Device Details – 22015
The Device Details overviews connected smart devices and plugs, focusing on their state, software version, and network connectivity. The device table shows key details such as device names, models, firmware versions, and current on/off status. A second panel lists individual plugs on power strips, showing their state and usage duration. A real-time graph at the bottom tracks each device’s signal strength over time. You can filter the dashboard by device, plug, and time zone using the dropdown menus at the top.
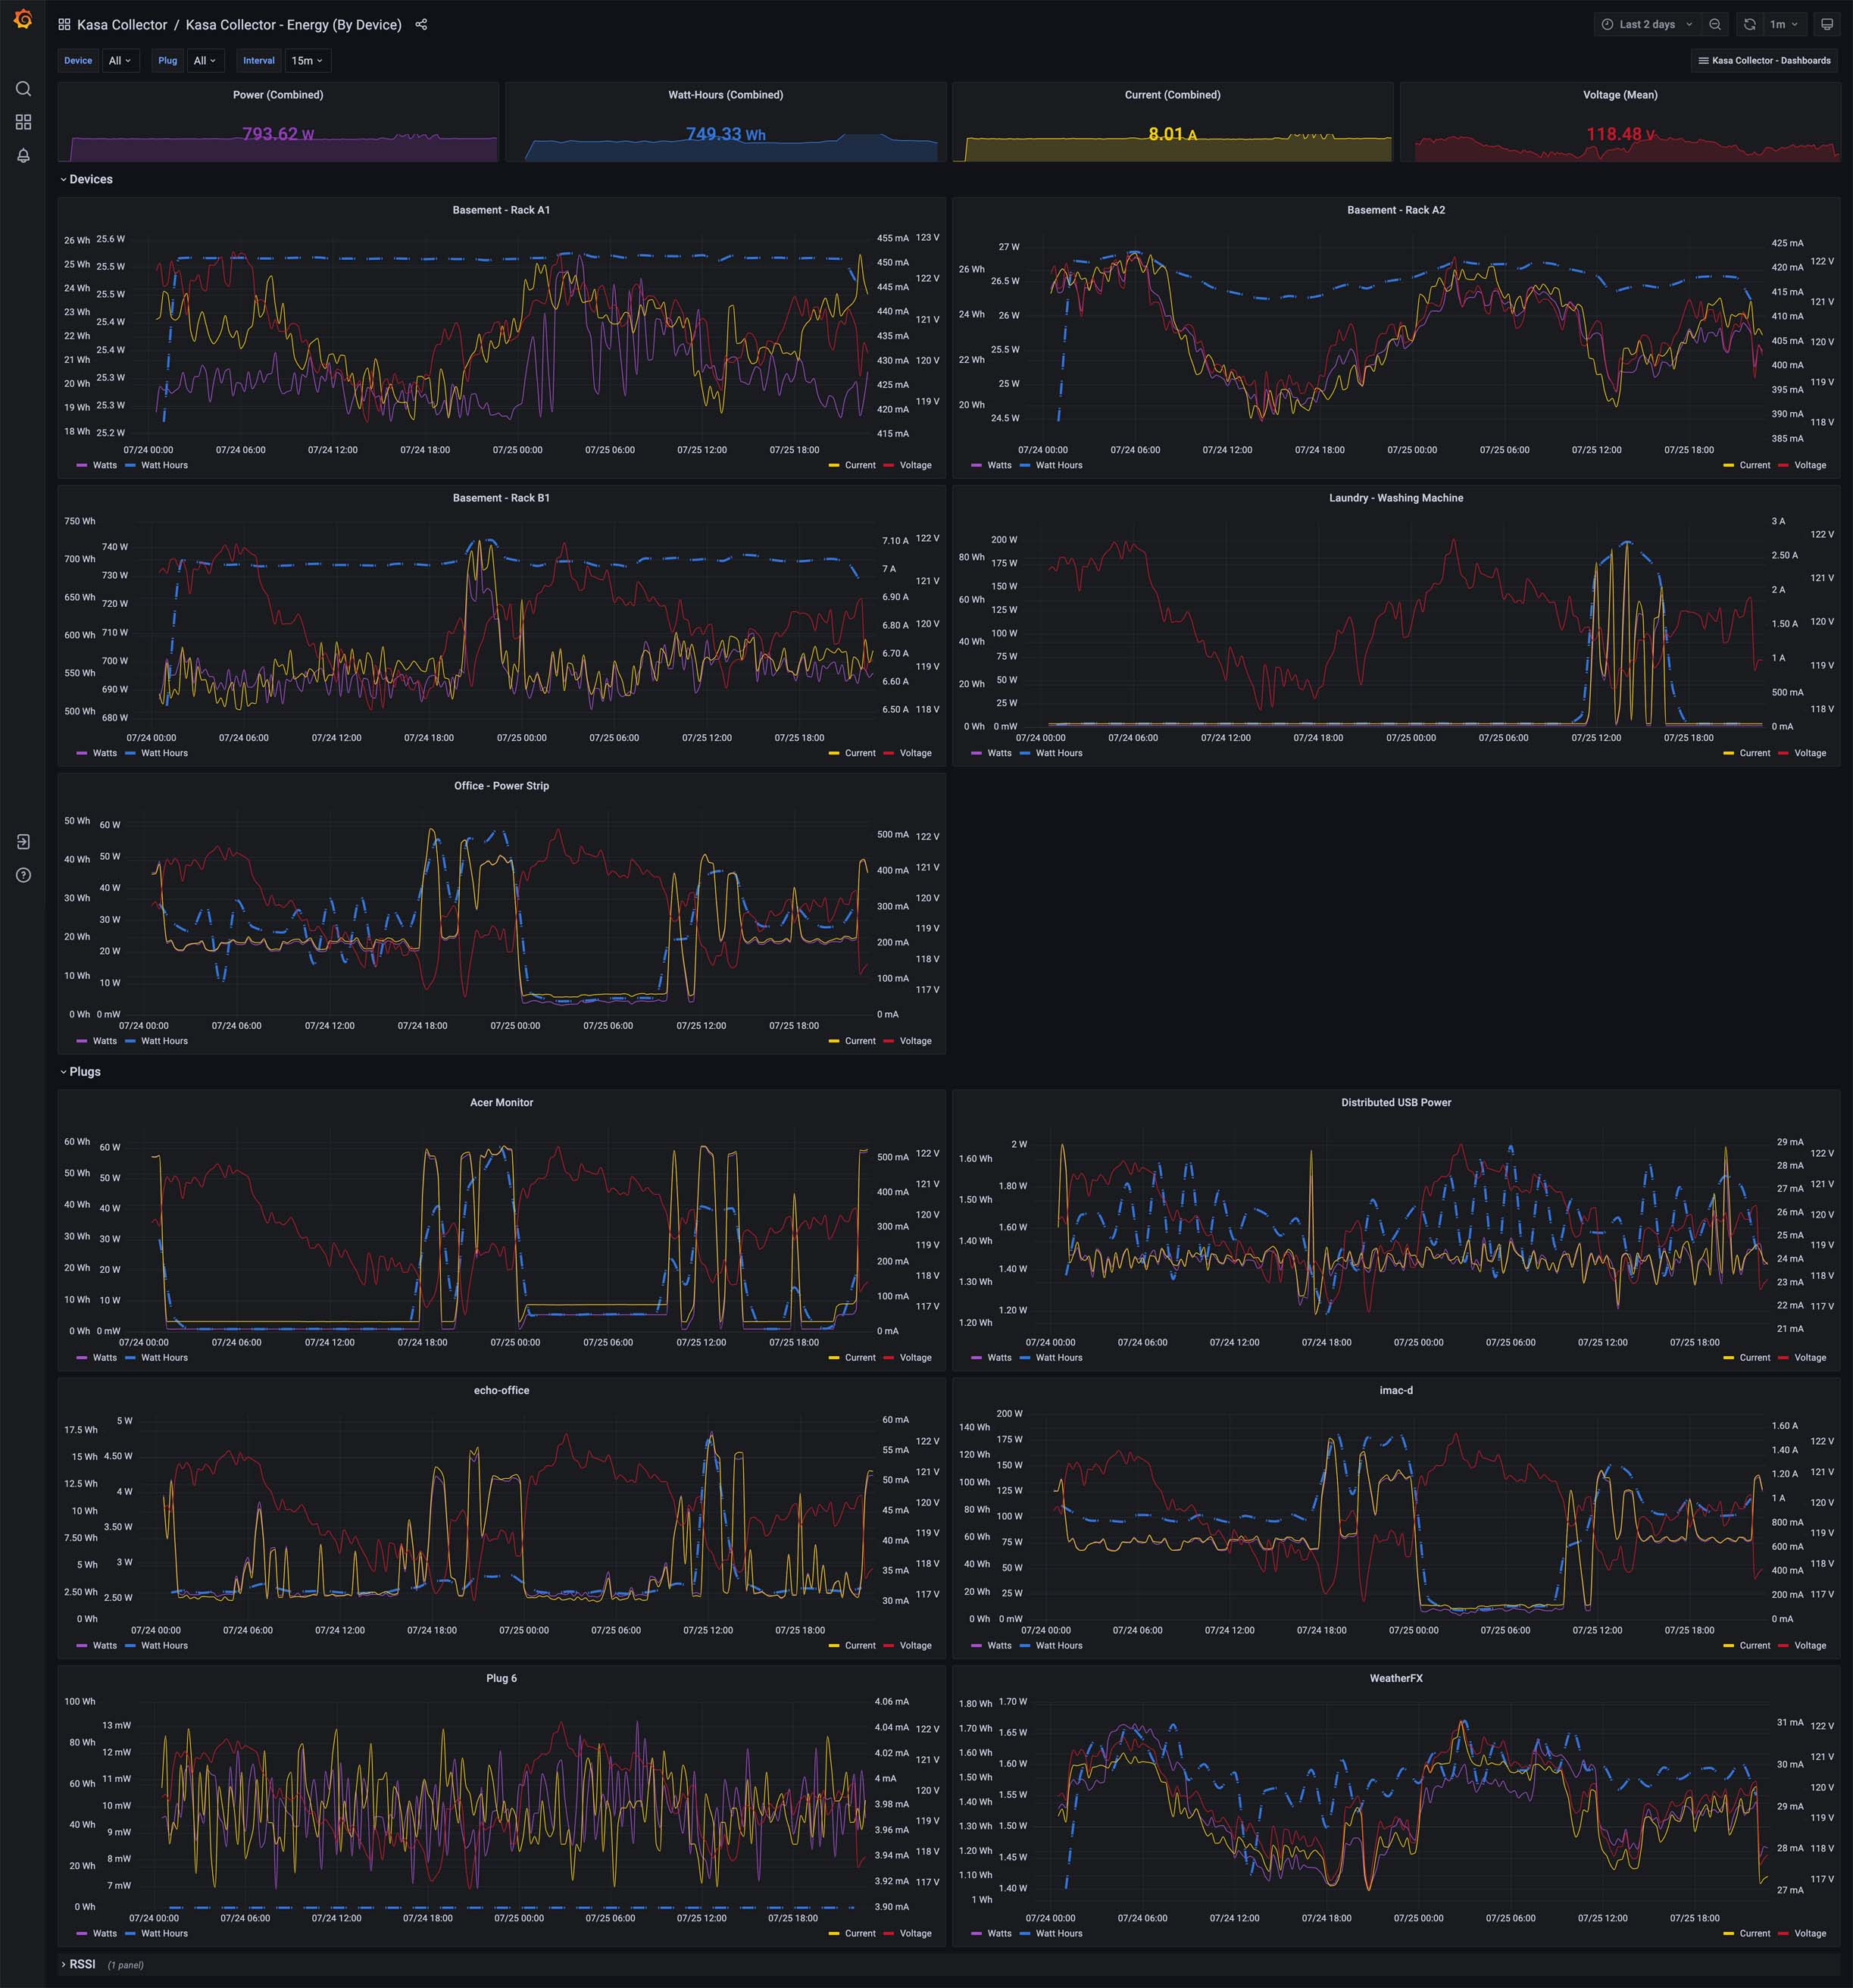
Kasa Collector – Energy (By Device) – 14772
The Energy (By Device) dashboard provides panels representing Power, Watt-Hours, Current, and Voltage. Measurements are at the top for total combined information (and voltage average) and rows for both devices and plugs (as part of power strips). You can use the device and plug dropdown menus at the top of the dashboard to filter on each. If you choose a single device that happens to be a power strip, only the plugs for that power strip will be shown in the Plugs dropdown.
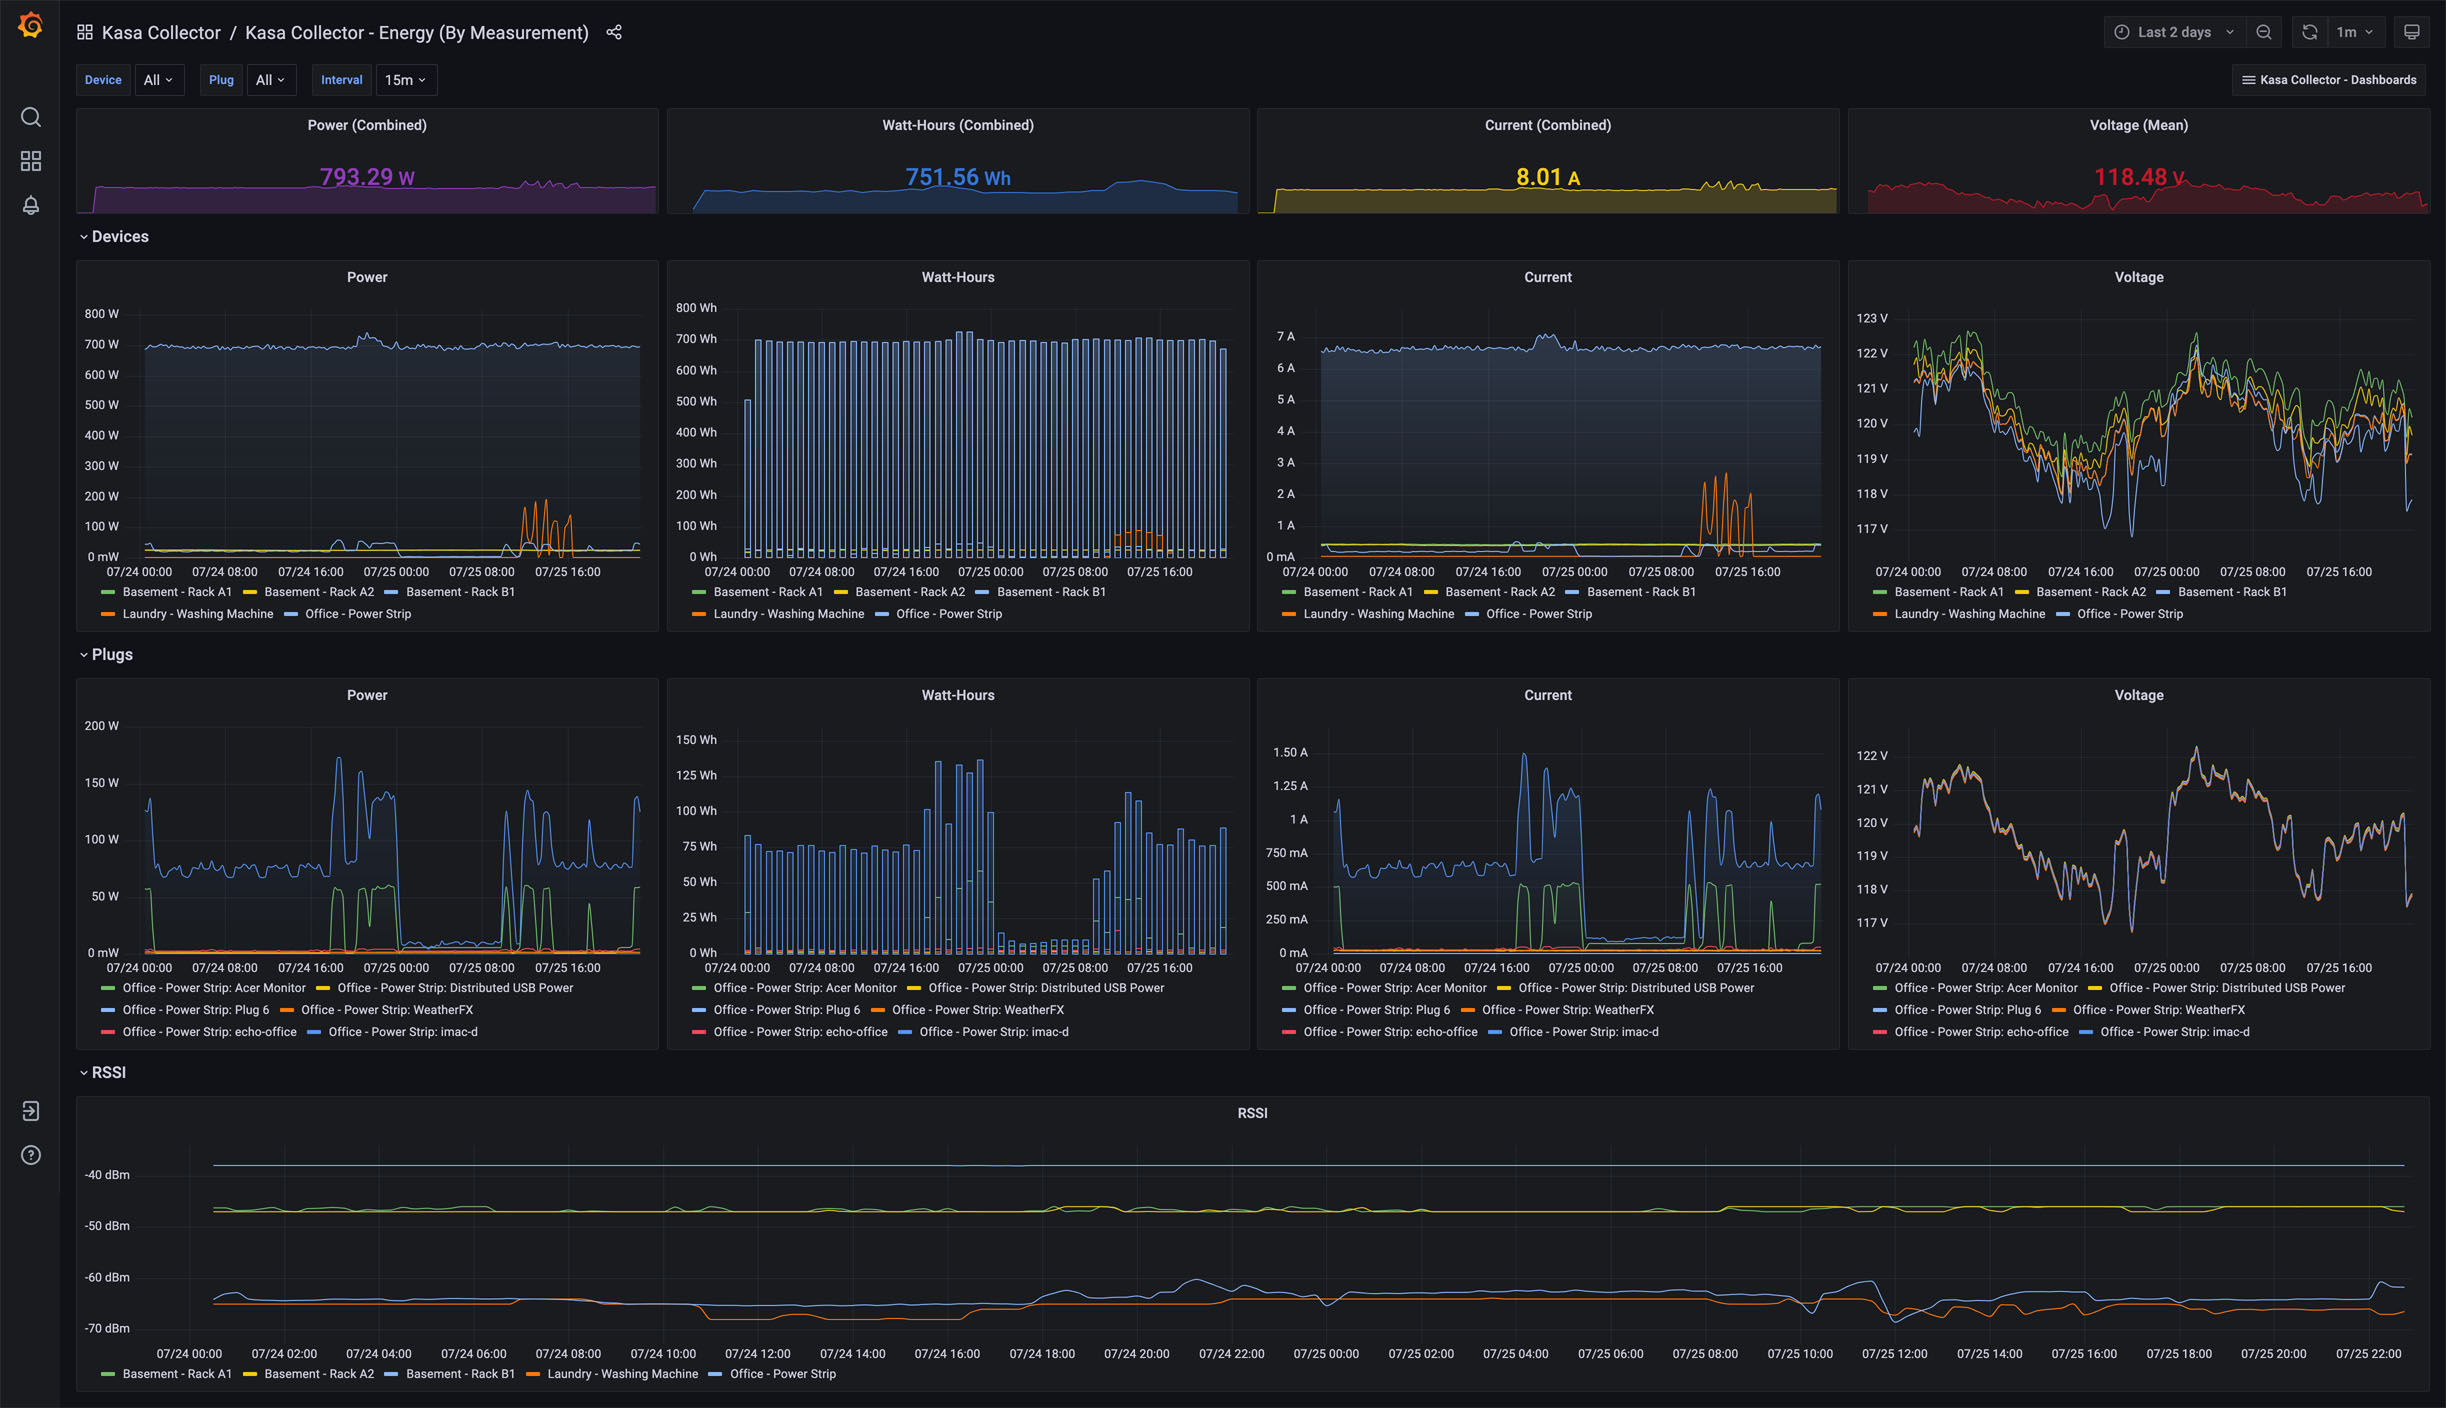
Kasa Collector – Energy (By Measurement) – 14762
The Energy (By Measurement) dashboard provides detailed insights into power, watt-hours, current, and voltage for both devices and plugs. At the top, combined power, watt-hours, current, and average voltage metrics are shown, offering a real-time summary of energy consumption across all devices. The Devices section includes separate charts for power, watt-hours, current, and voltage, allowing for a comparison of energy use between devices over time. Similarly, the Plugs section visualizes power, watt-hours, current, and voltage for individual plugs. An additional RSSI chart tracks the signal strength of devices, providing visibility into network performance and connectivity. This dashboard is designed for detailed energy analysis and performance monitoring.
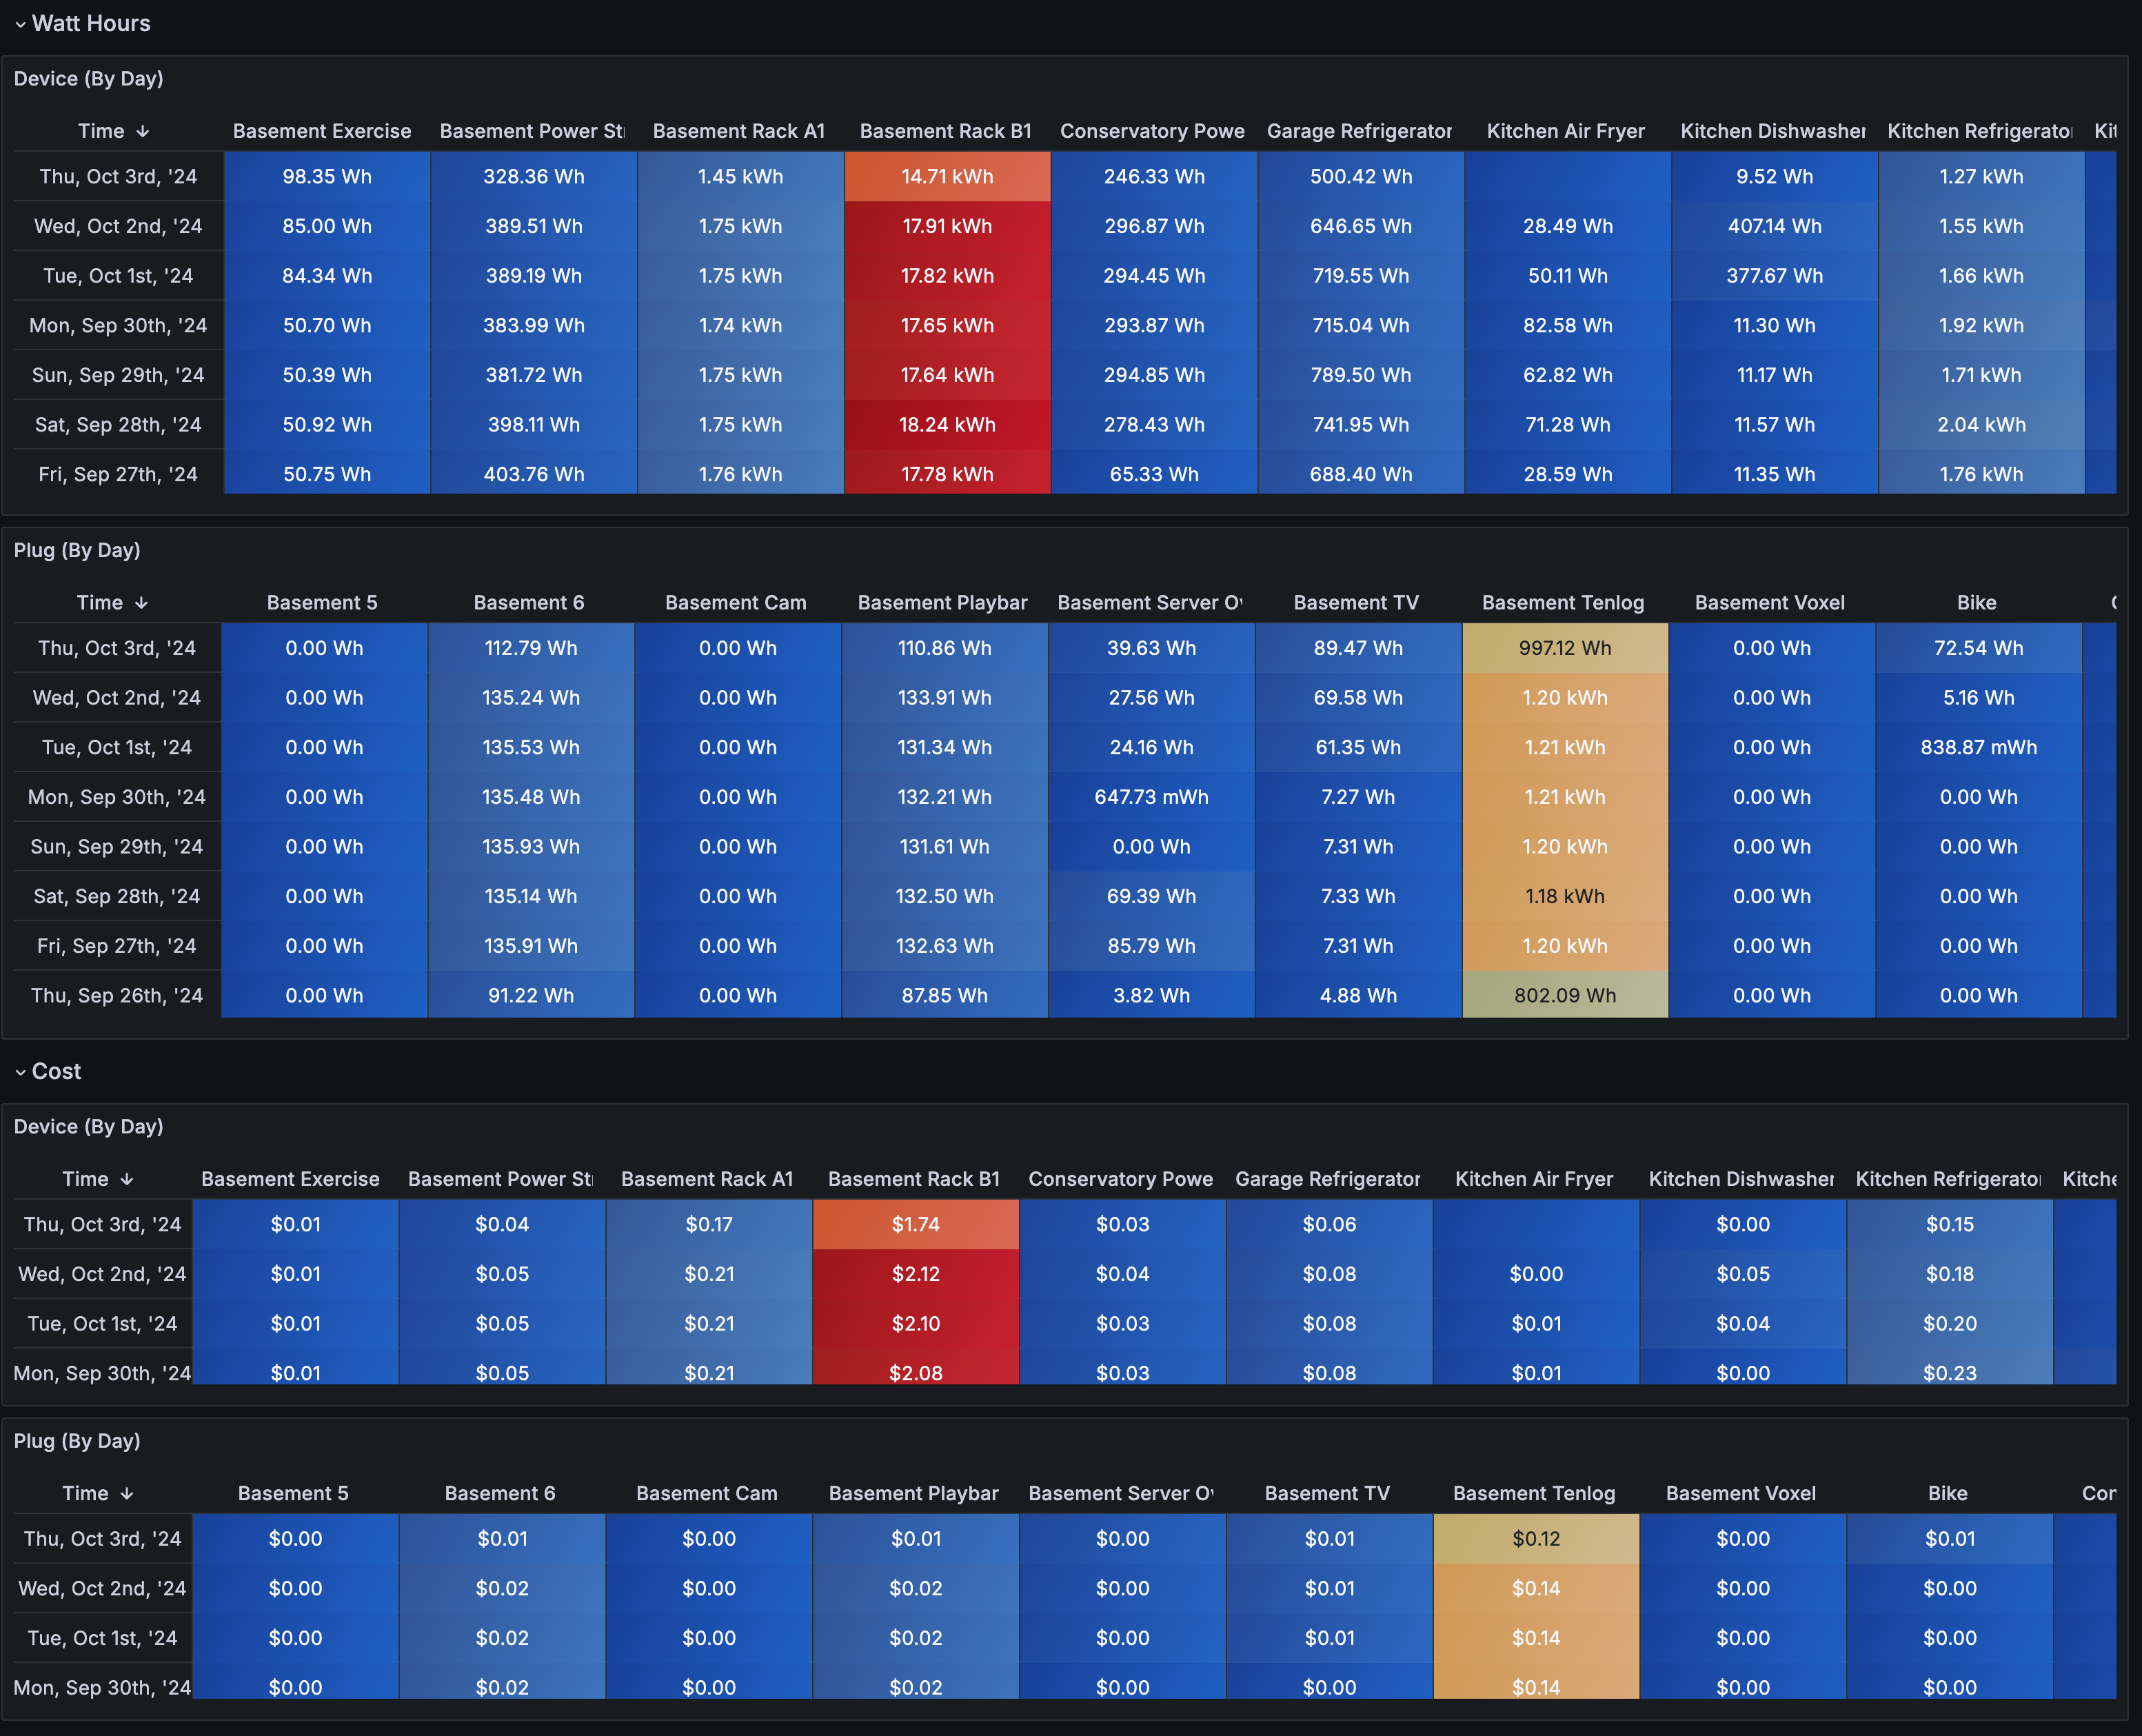
Kasa Collector – Energy (By Time) – 22014
The Energy (By Time) dashboard summarizes energy consumption and costs for devices and individual plugs over time. The Watt Hours panel shows the energy usage of each device per day, allowing for easy comparison of consumption patterns. A separate Plug panel details the energy usage of specific plugs on power strips, giving a granular view of power distribution across connected devices. The Cost panels provide the estimated daily cost of running each device and plug, helping you track energy expenses. You can monitor these trends across multiple days to identify usage patterns and adjust settings accordingly.
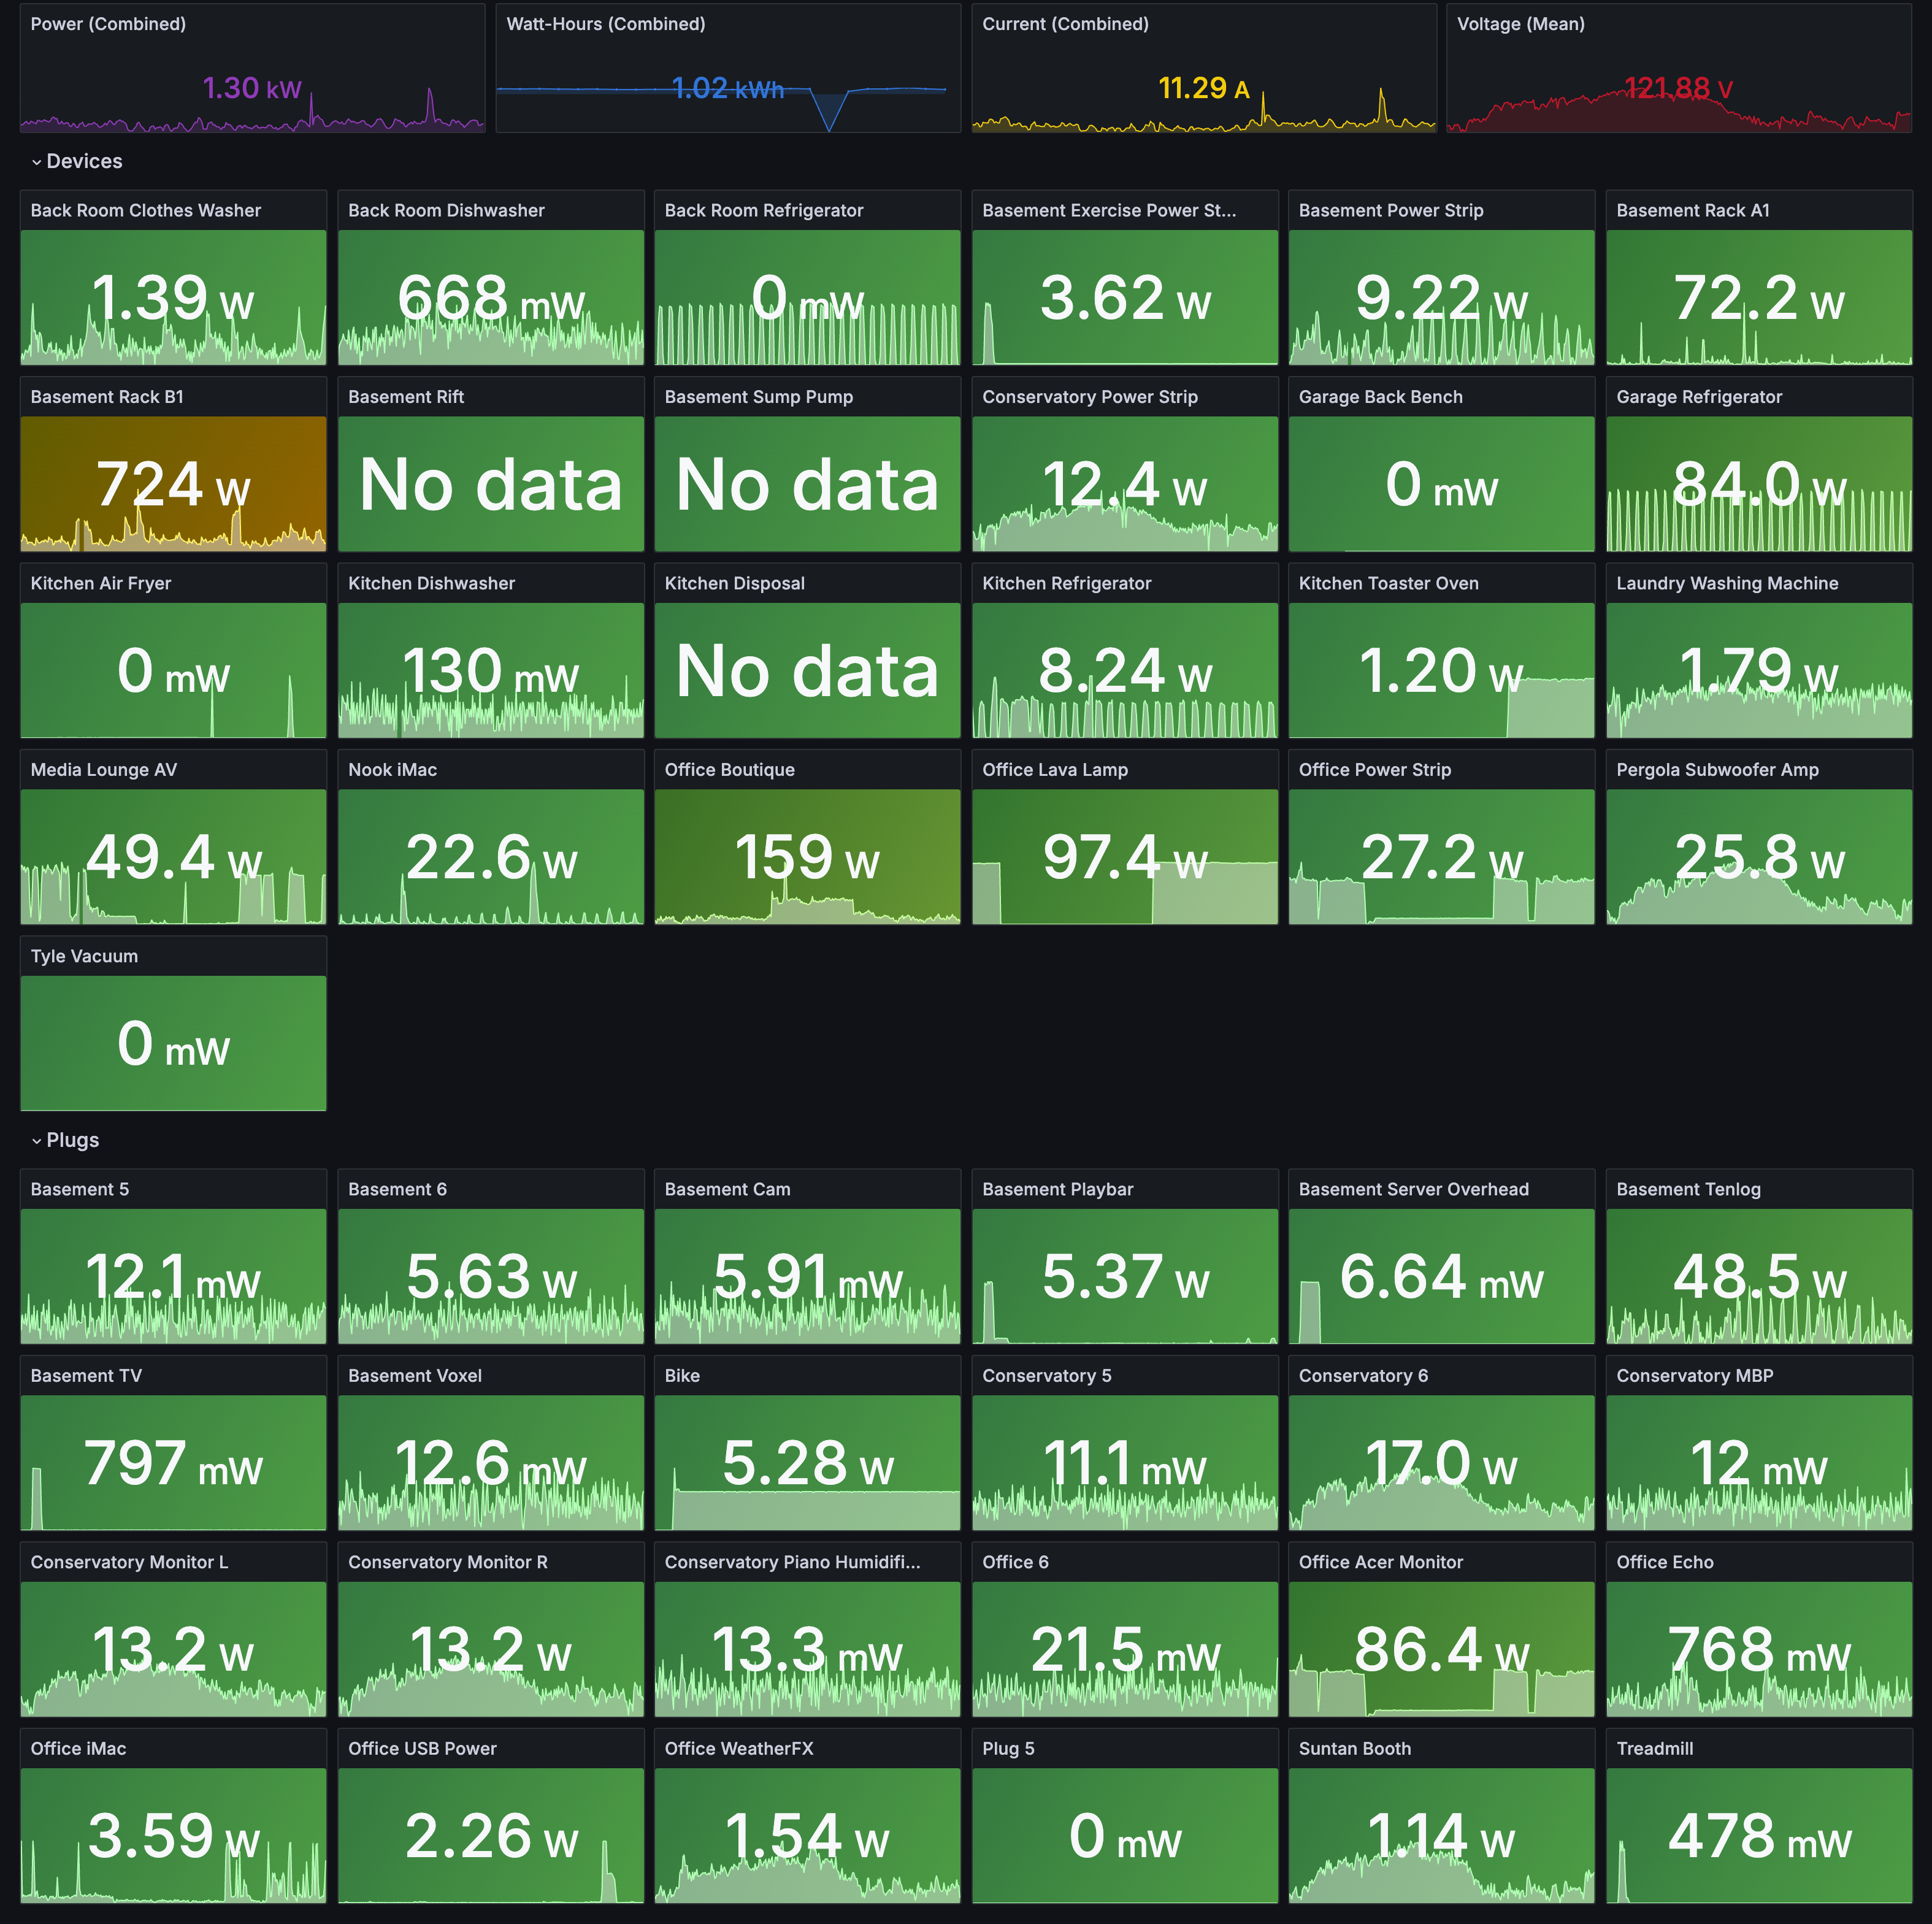
Kasa Collector – Status – 22015
The Status dashboard provides real-time power consumption monitoring for devices and plugs across the network. It displays combined metrics for power, watt-hours, current, and voltage at the top, offering a snapshot of overall energy usage. The device panel shows the current power draw for each device, with dynamic graphs that visualize their consumption over time. A separate panel tracks power usage for individual plugs, giving detailed insight into the energy consumption of each connected plug. This dashboard is designed for continuous monitoring, allowing users to assess device activity and energy performance at a glance quickly.