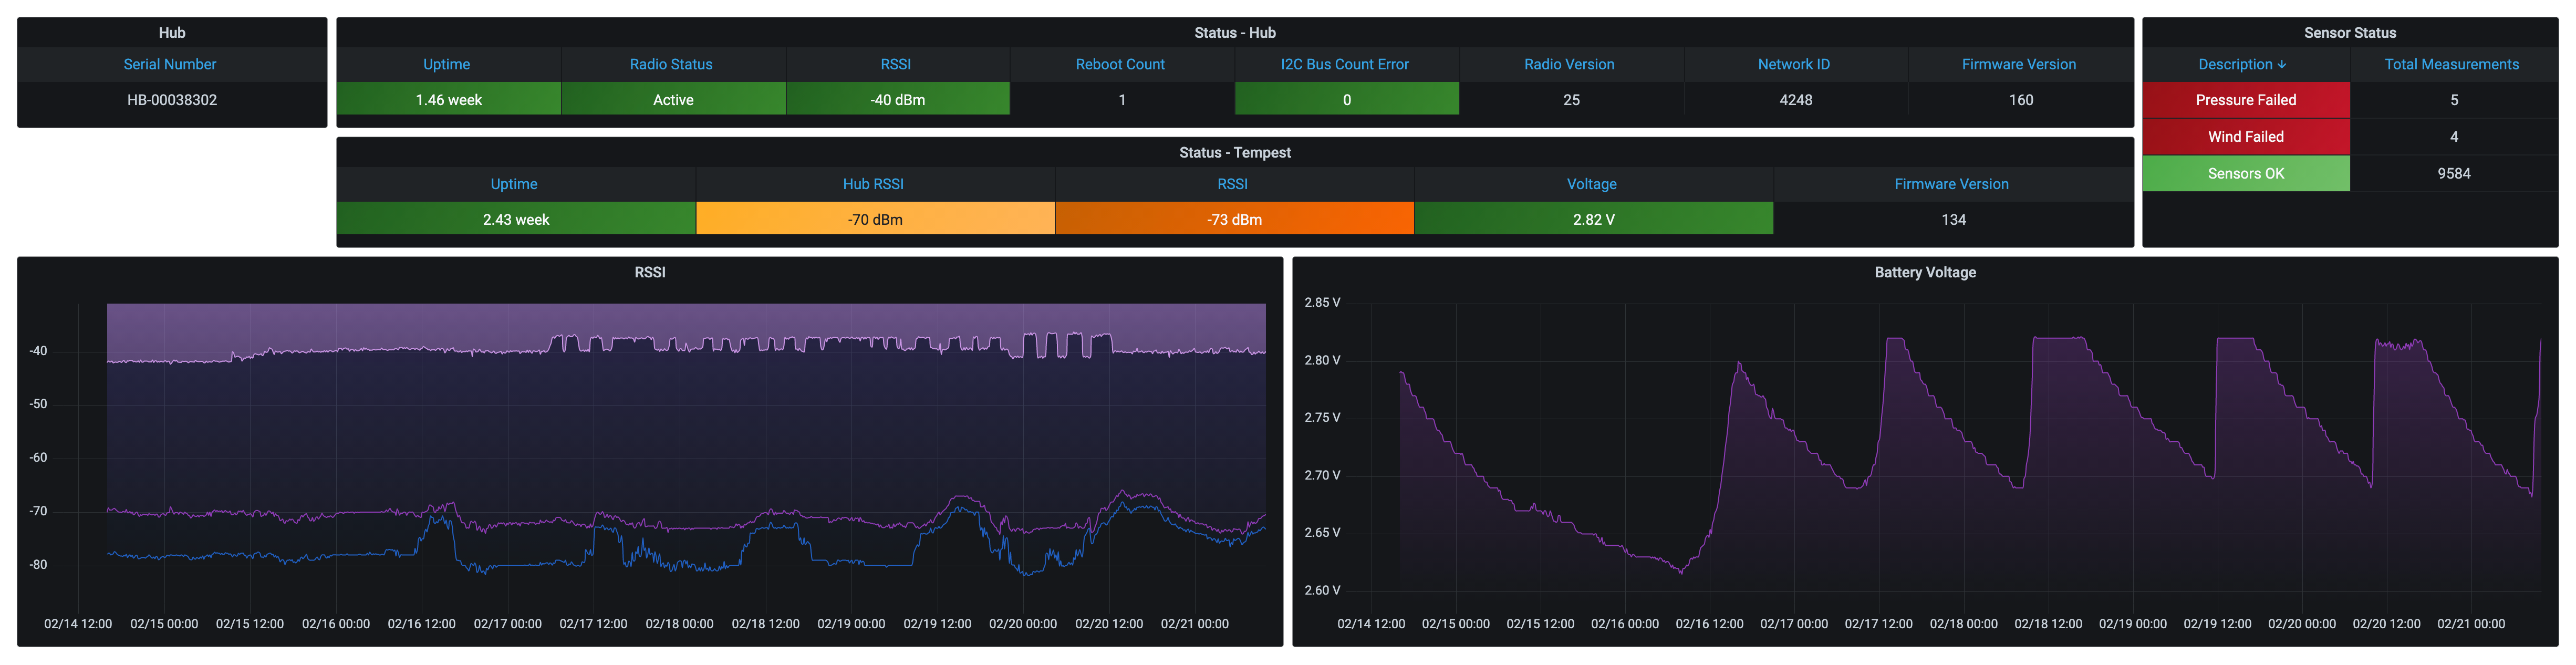
I started noticing some gaps in my home-lab monitoring solutions this week, but I didn’t pay much attention until I looked at it over time.

My SmartThings Prometheus exporter reaches out to the SmartThings API every 60 seconds and populates the status and metrics for each of my devices. I can make some nice Grafana dashboards that show battery levels, contact, motion, & switch status, power usage, temperature, and thermostats. But there’s nothing worse than seeing null values in my data!! UGH!!! (It makes for some seriously ugly graphs and missed alerts – unless you’re connecting null values…)

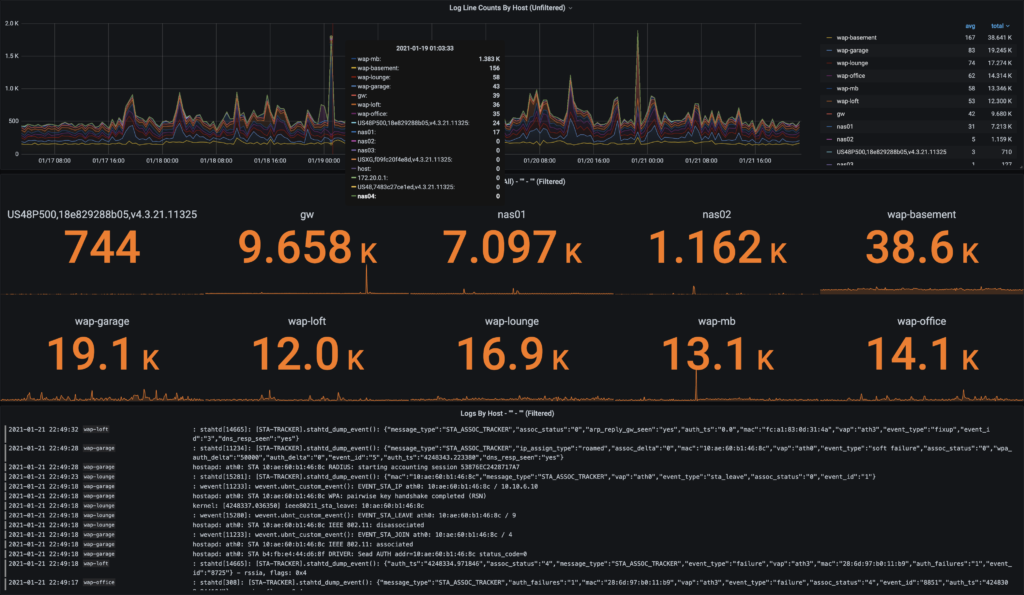
Because I also use Grafana’s Loki Docker Driver Client, I could quickly take a current and historical view of the logs from my SmartThings exporter. It wasn’t looking good:

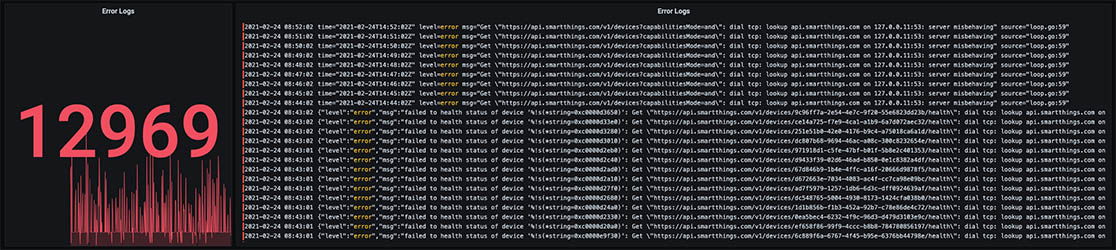
Something started kicking off a lot of errors around the 19th of February. And what are all these messages?

dial tcp: lookup api.smartthings.com on 127.0.0.11:53: server misbehaving" source="loop.go:59"

Specifically – looking up a server name on port 53 points to my local DNS server. To start troubleshooting – I tried doing some command line DNS lookups first:

# nslookup api.smartthings.com
Server: 10.10.3.80
Address: 10.10.3.80#53

Non-authoritative answer:
Name: api.smartthings.com
Address: 3.131.74.134
Name: api.smartthings.com
Address: 13.59.226.110
Name: api.smartthings.com
Address: 3.137.134.173
Name: api.smartthings.com
Address: 3.131.168.20
Name: api.smartthings.com
Address: 18.220.168.164
Name: api.smartthings.com
Address: 3.140.46.118
Name: api.smartthings.com
Address: 3.13.133.255
Name: api.smartthings.com
Address: 3.131.79.130

That looked fine. So I tried running it a few more times just to be sure, and I quickly received a different response:

# nslookup api.smartthings.com
Server: 10.10.3.80
Address: 10.10.3.80#53

** server can't find api.smartthings.com: REFUSED

Refused huh? (I shall not be REFUSED!!)

Let me try a local network server:

# nslookup grafana01.tylephony.com
Server: 10.10.3.80
Address: 10.10.3.80#53

** server can't find grafana01.tylephony.com: REFUSED

Since I use and love Pi-hole as my local DNS and DHCP server, I quickly searched their forums and found a similar issue. But the response didn’t make sense in my case: “Pi-hole is not refusing it, your upstream is refusing to provide an answer.”

Pi-hole IS my upstream server!!

More digging in the forums revealed the most recent release notes for Pi-hole FTL v5.7 and Web v5.4. This caught my eye:

Inbuilt enhanced Denial-of-Service (DoS) protection

Hence, we decided to implement a customizable rate-limiting into FTL itself. It defaults to the rather conservative limit of allowing no more than 1000 queries in a 60 seconds window for each client. Afterwards, any further queries are replied to with empty replies with the status set to REFUSED. Both the number of queries within the window as well as the window size can be configured by the user. It is important to note that rate-limiting is happening on a per-client basis. Other clients can continue to use FTL while rate-limited clients are short-circuited at the same time.

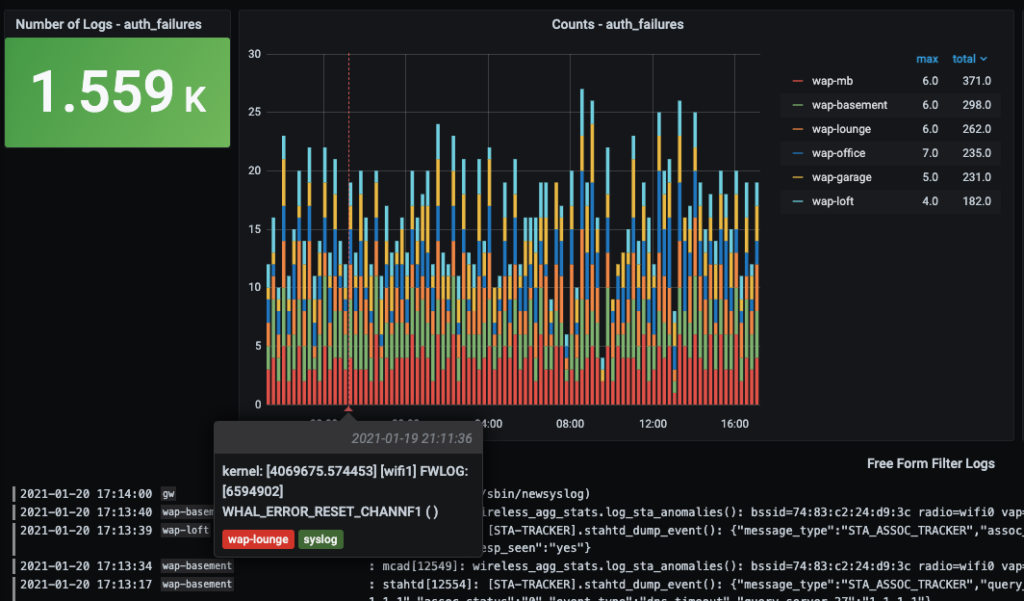
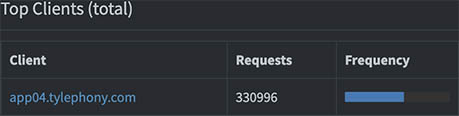
Because I monitor many of my servers with Grafana, Prometheus, and InfluxDB, I often ping DNS. It’s around 5 million times a day. And I did just update my Pi-hole servers. A look back at my Pi-hole DNS stats shows more of this trend over time, both before and after this update.

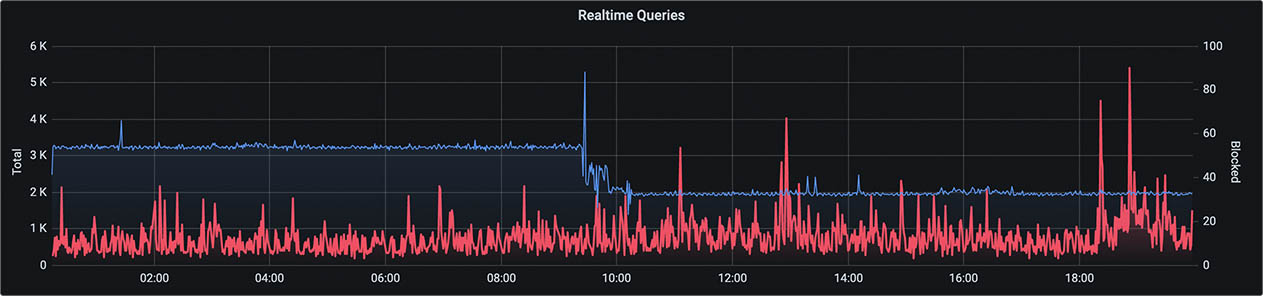
Since the server I have running my SmartThings exporter also runs a lot of other exporters and metrics collectors, Pi-hole was rate-limiting that client.

Thankfully, an easy fix:

Rate-limiting can easily be disabled by setting RATE_LIMIT=0/0 in /etc/pihole/pihole-FTL.conf. If I want, say, to set a rate limit of 1 query per hour, the option should look like RATE_LIMIT=1/3600.

So – any lessons learned?

  • Read the release notes before deploying any updates. (Nope!)
  • Limit the rate interval or the number of metrics and exporters to ease the number of DNS queries. (Nope!)
  • Set up default error alerting to catch problems sooner. (Soon!!)

Happily – no more gaps…

This started as a straightforward story with three simple things:

  1. I love IoT gadgets.
  2. I love weather gadgets.
  3. I love charts and graphs.

While perusing online, it’s possible that I stumbled upon a social media advertisement for the WeatherFlow Tempest Weather System (and a 15% off coupon). It’s also entirely possible that I made a quick purchase.

WeatherFlow Tempest started as a Kickstarter project but is now shipping directly outside of just the backers. The WeatherFlow Tempest is a solar-powered weather station that collects measurements of wind, rain, lightning, temperature, humidity, pressure, and sunlight. It has a wireless hub collects these data points, pushes them up to the WeatherFlow cloud for processing and weather forecasting, and then provides a personalized weather app. Data can be collected with a few different APIs – one from WeatherFlow’s processed stream of events and metrics (REST API) or locally via my network with UDP listener API.

Yes. Now we’re talking. APIs. Raw data. Wireless. Weather data. All that means “How can I use my data to make charts and graphs!”

Logs Into Metrics

With any new project – it’s always best to start and see what other great work has already been shared with the community. I found a great InfluxDB listener from Vince Skahan called weatherflow-udp-listener. I made the first set of Grafana dashboards that used his system, which worked well. But as much as I loved Vince’s efforts – the project isn’t currently supported (but should work just fine for the foreseeable future…)

I wanted to work with the raw JSON logs being streamed over UDP from the Tempest to the WeatherFlow hub. I needed a way to collect those JSON logs and push them into a logging system that provides long-term storage AND a way to turn logs into metrics. What better solution than Grafana’s Loki log aggregation system?

JSON Logs

The WeatherFlow hub sends JSON logs broadcast over UDP port 50222 on my local network. Based on the WeatherFlow Tempest UDP Reference, these logs can be broken out by type (among a few other measurements):

obs_st (Observation – Tempest)

{"serial_number":"ST-00028209","type":"obs_st","hub_sn":"HB-00038302","obs":[[1613934241,0.00,1.34,5.45,93,3,988.74,9.39,28.68,7761,0.23,65,0.000000,0,0,0,2.808,1]],"firmware_revision":134}

device_status

{"serial_number":"ST-00028209","type":"device_status","hub_sn":"HB-00038302","timestamp":1613934241,"uptime":1478650,"voltage":2.81,"firmware_revision":134,"rssi":-69,"hub_rssi":-66,"sensor_status":0,"debug":0}

hub_status

{"serial_number":"HB-00038302","type":"hub_status","firmware_revision":"160","uptime":895935,"rssi":-39,"timestamp":1613934260,"reset_flags":"PIN,SFT","seq":89486,"fs":[1,0,15675411,524288],"radio_stats":[25,1,0,3,4248],"mqtt_stats":[119,29]}

rapid_wind

{"serial_number":"ST-00028209","type":"rapid_wind","hub_sn":"HB-00038302","ob":[1613934245,0.67,152]}

Using a slightly modified weatherflow-listener.py script (from P-Doyle’s Simple-WeatherFlow-Python-Listener), I could use the following command to send the broadcast JSON logs into Loki via Promtail.

/usr/bin/stdbuf -oL /usr/bin/python weatherflow-listener.py | /usr/bin/promtail --stdin --client.url http://loki:3100/loki/api/v1/push --client.external-labels=app=weatherflow,hostname=weatherflow

(Using stdbuf here to reduce the STDOUT/STDIN buffer wait…)

Once the logs are in Grafana Loki – I used Loki’s LogQL to crack open some of the JSON arrays into useful metrics:

max(max_over_time({app="weatherflow"} |= "obs_st" | json obs_Air_Temperature="obs[0][7]" | unwrap obs_Air_Temperature | __error__="" [$__interval])) * 9/5 + 32

Using the WeatherFlow UDP API as a guide, I made metrics from each of the index values:

Observation Value Layout

Index Field Units
0 Time Epoch Seconds
1 Wind Lull (minimum 3 second sample) m/s
2 Wind Avg (average over report interval) m/s
3 Wind Gust (maximum 3 second sample) m/s
4 Wind Direction Degrees
5 Wind Sample Interval seconds
6 Station Pressure MB
7 Air Temperature C
8 Relative Humidity %
9 Illuminance Lux
10 UV Index
11 Solar Radiation W/m^2
12 Precip Accumulated mm
13 Precipitation Type 0 = none, 1 = rain, 2 = hail
14 Lightning Strike Avg Distance km
15 Lightning Strike Count
16 Battery Volts
17 Report Interval Minutes

Grafana Dashboards

The rest of my efforts were turning those metrics into usable information – coming up with an Overview, Today So Far, and a Device Details set of Grafana dashboards.

Like my previous Loki Syslog All-In-One project – I created an All-In-One project for this WeatherFlow collector. Details on installing your own collector, including all the files needed to download, are over at my WeatherFlow Dashboards AIO Github repository. These dashboards are also available in Grafana’s Community Dashboards. With some help from P-Doyle’s Simple-WeatherFlow-Python-Listener and Promtail – you too can deploy a quick and easy WeatherFlow log collector with Grafana Loki and Grafana dashboards.

If you’re a WeatherFlow fan, I’d love any feedback on how this works. If you’d like to share your dashboards, I’d happily include them here to share with the community!

These dashboards are also part of my Internet-facing set of current Grafana dashboards. Enjoy!!

Loki Syslog Overview

I’ll be the first to admit I’ve always been a metrics person. Charts and graphs through and through. Almost to a fault – I largely ignored logs. That’s not to say I haven’t combed through my fair share of application logs across hundreds of endpoints. Do you remember the days of creating shared NAS exports and just writing out logs until they filled up? (Yeah – me neither… ahem…) But recently, two things have come to light in the last few months that make this hopefully an exciting story to tell. One, I discovered Loki, Grafana’s log aggregation system. And two, I have a handful of home lab servers, an increasingly complex network, and storage devices that are hard to see what they’re doing all the time. My initial challenge involved understanding why my wireless devices had intermittent network instability and which (if any) of my wireless access points had the most issues. But all I had to work with was Syslog.

A search on Google for “Syslog Collector” presented me with 342,000 results to start my effort. Most of the attention-grabbing “6 Free Syslog Servers” links turned into a fair number of Windows utilities, but each is still pretty limited to just a few hosts at a time. I needed to collect data from over a dozen systems and run on Linux and MacOS. What I needed was some Open Source goodness.

This now becomes a tale of how I came to love logs.

And Loki. <3

My first exposure to Loki came recently during my first days at Grafana Labs. Presented with a fantastic way to discover and consume logs in relationship to Prometheus and Kubernetes with microservices – it didn’t immediately occur to me to capture standalone network logs with Loki in this same fashion. And so I set out to see what I could accomplish.

Loki is relatively easy to deploy as a single binary via the command line or Docker. One of the primary ways to get logs into Loki is using Promtail, which is also easily deployed the same way. I jumped into docker-compose (even with Loki’s roots coming from Prometheus and Kubernetes – I’m looking to build out essentially a quick start standalone Syslog ingester.)

A look through some of the Loki documentation on configuring Promtail with Syslog had me realize that Promtail only works with IETF Syslog (RFC5424) – which is how I also found out my devices were limited to only RFC3164. Time to look at syslog-ng!!

What’s valuable about syslog-ng in my situation is that it can be spun up to listen for RFC3164 (UDP port 514) and then forward it to Promtail RFC5424 on port 1514. (Many of my devices only output the older style of Syslog…) I needed to do a few quick configurations to get syslog-ng and Promtail talking to each other!

syslog-ng Configuration

# syslog-ng.conf

source s_local {
    internal();
};

source s_network {
    default-network-drivers(
    );
};

destination d_loki {
    syslog("promtail" transport("tcp") port("1514"));
};

log {
        source(s_local);
        source(s_network);
        destination(d_loki);
};

Promtail Configuration


# promtail-config.yml

server:
  http_listen_port: 9080
  grpc_listen_port: 0

positions:
  filename: /tmp/positions.yaml

clients:
  - url: http://loki:3100/loki/api/v1/push

scrape_configs:

- job_name: syslog
  syslog:
    listen_address: 0.0.0.0:1514
    idle_timeout: 60s
    label_structured_data: yes
    labels:
      job: "syslog"
  relabel_configs:
    - source_labels: ['__syslog_message_hostname']
      target_label: 'host'

The relabeling in Promtail takes the hostname of the sending device into syslog-ng and turns it into a host label for Loki to index. Within a few minutes, all of my hosts were streaming Syslog from my network into Loki and explorable within Grafana!

Now – around this same time, Loki 2.0 was released. Ward Bekker had just presented to our team some of the launch efforts and dashboard examples he worked on when I heard him say to me…

“Dave – look how easy it is to turn logs into metrics!” ~ Ward Bekker

Ward – you have my attention!! At this point, I expedited my efforts to build a dashboard that combined how easy it was to gather my logs into an even easier way to sort, search, filter, and present helpful information with dashboards showing all device logs.

Within a few minutes, I had a working dashboard to configure a drop-down of pre-defined search terms or use a free-form search for items in my logs. Then, I applied the “logs to metrics” magic and presented group summaries of counts by wireless access points!

Loki First Dashboard

Oh yeah – my first LogQL query!! Showing the number of logs over time filtered by hostname (host= “$hostname”), coming from my Syslog Promtail job (job= “syslog”), with a free-form search query string from my Grafana variable ($filter).

count_over_time({host=~"$hostname", job="syslog"}[$__interval] |="$filter”)

With a bit more dashboard usability tweaking, I could visualize other types of logging from my gateway devices, server IPMI stats, and NAS details – all available to scroll back through time. And finally – building out alerting for threshold breaching (yes… logs into metrics!! More on alerting in a follow-up post.)

So, while a pretty simple example of how I got started with Loki and my logging journey – I believe it represents how quick and easy it is to connect Open Source solutions to solve immediate problems – even in a home lab situation.

I also wanted to share these configurations, and what better way to do that than with a kind of “All In One” docker-compose project? So, I present to you the following:

Grafana Loki Syslog All-In-One Project

Loki Syslog AIO

This quick example project allows you to run these services with docker-compose on a Linux server. Point your network devices at (hostname:514) and log into Grafana (hostname:3000) and you’ll be presented with the “Loki Syslog AIO – Overview” dashboard. For those of you who want to see some of the behind-the-scenes details, I’ve included some prebuilt performance overview dashboards for each of the primary services (Grafana, Loki, MinIO, Docker, and host metrics.) You’ll see dropdown links to the “Performance Overview” at the top of the Loki Syslog AIO – Overview dashboard, including links to get you back to the starting dashboard. If you don’t have Syslog devices immediately available but want to try the dashboard out – I also built an optional Syslog Generator container.

Check out my Grafana Loki Syslog AIO GitHub repository for more setup details and downloads. My example, Loki Dashboard, is available in Grafana’s Community Dashboards.

And yes – I did figure out that my dropped connections were related to high DHCP retries and too aggressive of settings on my minimum data rate controls. Now I know! Thanks, Loki!!

Grafana Loki Icon

“You cannot step into the same river twice, for other waters are continually flowing on.” ~ Heraclitus

I stumbled upon that analogy some time back, and I think it’s a good way of talking about change. For me, joining the Solutions Engineering team at Grafana is a continuation of embracing change and enjoying my professional journey. As I look back over my first several months here, I wanted to share some of my journey and a few thoughts on what I’m most looking forward to.

How My Journey Started

  • I’ve been running metrics since the days of Perl scripts and RRD Graphs (Hats off to Cacti). I started in Enterprise IT when I worked at Citigroup and started accelerating with building a fantastic APM team using BMC Patrol and Precise APM.
  • Opportunity to launch my Sales Engineering career by joining HP Software with solutions from their Mercury Interactive acquisition with HP Business Service Management.
  • Some time with BMC Software with their ITSM and Cloud solutions. (Always Remedy Green!)
  • Last three years deep into APM with Cisco AppDynamics.
  • This led to the opportunity to join Grafana Labs this year and help drive the adoption of Grafana’s Observability Stack of metrics, logs, and tracing.

Since Arriving At Grafana

Everybody at Grafana deeply believes that data and its visualization should be easy to use, understand, and act upon by all. As an open-source software startup company, Grafana delivers on sharing opening and transparently.

Our team is the most energized, thoughtful, and empowered stewards of “All Things Grafana.” But it extends beyond our namesake. It’s compelling open-source solutions to big problems facing today’s Observability efforts, and we lead our community and customers with consultative guidance on solving real visibility issues.

We Love Visualizing Data!!

I published a quick video showcasing some of the Grafana Dashboards I built along my Journey Into Grafana. (With a great excuse to write some new music as well!!) The dashboards include:

(I’ll publish some follow-up blog posts on these dashboards and data exporters shortly…)

What Does the Future of Grafana Look Like?

First, it’s the continuing acceleration of compelling and valuable adoption across all our solutions, Grafana, Loki, and our recently released Tempo. Grafana releases every few months, and I can tell you that we cover all parts of our community open-source platforms and our Enterprise products.

Cloud-native is accelerating at a ferocious pace. That means delivering platforms that scale to collect and visualize high velocity, fine-grained observability that is a critical underpinning for everything we do. It’s about thinking differently and having diverse and inclusive relationships with our teams, community, and customers.

Growth. My journey to Grafana was based on great culture and the ability to deliver amazing and collaborative outcomes across our organization personally. From Engineering and Marketing to Sales and Solutions Engineering – Grafana has incredible opportunities for great candidates worldwide. Please reach out and be part of our great team!

Thanks!

I’m fortunate to have many great friends, family, colleagues, and customers who have joined me along my incredible journey. I look forward to sharing with the community what makes Grafana such a respected and loved solution.