This started as a straightforward story with three simple things:
- I love IoT gadgets.
- I love weather gadgets.
- I love charts and graphs.
While perusing online, it’s possible that I stumbled upon a social media advertisement for the WeatherFlow Tempest Weather System (and a 15% off coupon). It’s also entirely possible that I made a quick purchase.
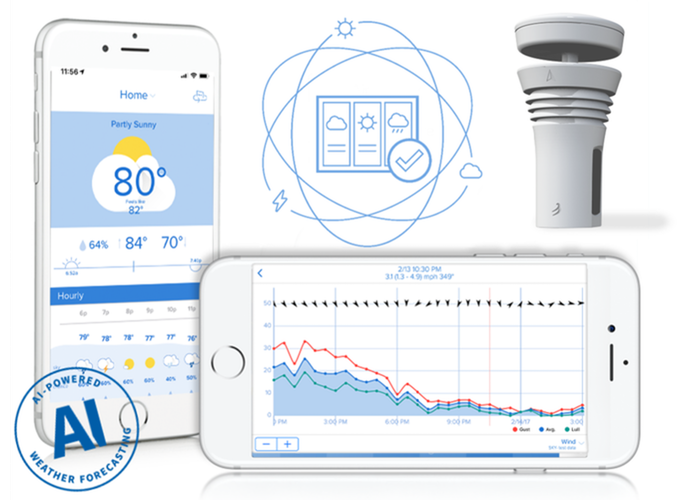
WeatherFlow Tempest started as a Kickstarter project but is now shipping directly outside of just the backers. The WeatherFlow Tempest is a solar-powered weather station that collects measurements of wind, rain, lightning, temperature, humidity, pressure, and sunlight. It has a wireless hub collects these data points, pushes them up to the WeatherFlow cloud for processing and weather forecasting, and then provides a personalized weather app. Data can be collected with a few different APIs – one from WeatherFlow’s processed stream of events and metrics (REST API) or locally via my network with UDP listener API.
Yes. Now we’re talking. APIs. Raw data. Wireless. Weather data. All that means “How can I use my data to make charts and graphs!”
Logs Into Metrics
With any new project – it’s always best to start and see what other great work has already been shared with the community. I found a great InfluxDB listener from Vince Skahan called weatherflow-udp-listener. I made the first set of Grafana dashboards that used his system, which worked well. But as much as I loved Vince’s efforts – the project isn’t currently supported (but should work just fine for the foreseeable future…)
I wanted to work with the raw JSON logs being streamed over UDP from the Tempest to the WeatherFlow hub. I needed a way to collect those JSON logs and push them into a logging system that provides long-term storage AND a way to turn logs into metrics. What better solution than Grafana’s Loki log aggregation system?
JSON Logs
The WeatherFlow hub sends JSON logs broadcast over UDP port 50222 on my local network. Based on the WeatherFlow Tempest UDP Reference, these logs can be broken out by type (among a few other measurements):
obs_st (Observation – Tempest)
{"serial_number":"ST-00028209","type":"obs_st","hub_sn":"HB-00038302","obs":[[1613934241,0.00,1.34,5.45,93,3,988.74,9.39,28.68,7761,0.23,65,0.000000,0,0,0,2.808,1]],"firmware_revision":134}
device_status
{"serial_number":"ST-00028209","type":"device_status","hub_sn":"HB-00038302","timestamp":1613934241,"uptime":1478650,"voltage":2.81,"firmware_revision":134,"rssi":-69,"hub_rssi":-66,"sensor_status":0,"debug":0}
hub_status
{"serial_number":"HB-00038302","type":"hub_status","firmware_revision":"160","uptime":895935,"rssi":-39,"timestamp":1613934260,"reset_flags":"PIN,SFT","seq":89486,"fs":[1,0,15675411,524288],"radio_stats":[25,1,0,3,4248],"mqtt_stats":[119,29]}
rapid_wind
{"serial_number":"ST-00028209","type":"rapid_wind","hub_sn":"HB-00038302","ob":[1613934245,0.67,152]}
Using a slightly modified weatherflow-listener.py script (from P-Doyle’s Simple-WeatherFlow-Python-Listener), I could use the following command to send the broadcast JSON logs into Loki via Promtail.
/usr/bin/stdbuf -oL /usr/bin/python weatherflow-listener.py | /usr/bin/promtail --stdin --client.url http://loki:3100/loki/api/v1/push --client.external-labels=app=weatherflow,hostname=weatherflow
(Using stdbuf here to reduce the STDOUT/STDIN buffer wait…)
Once the logs are in Grafana Loki – I used Loki’s LogQL to crack open some of the JSON arrays into useful metrics:
max(max_over_time({app="weatherflow"} |= "obs_st" | json obs_Air_Temperature="obs[0][7]" | unwrap obs_Air_Temperature | __error__="" [$__interval])) * 9/5 + 32
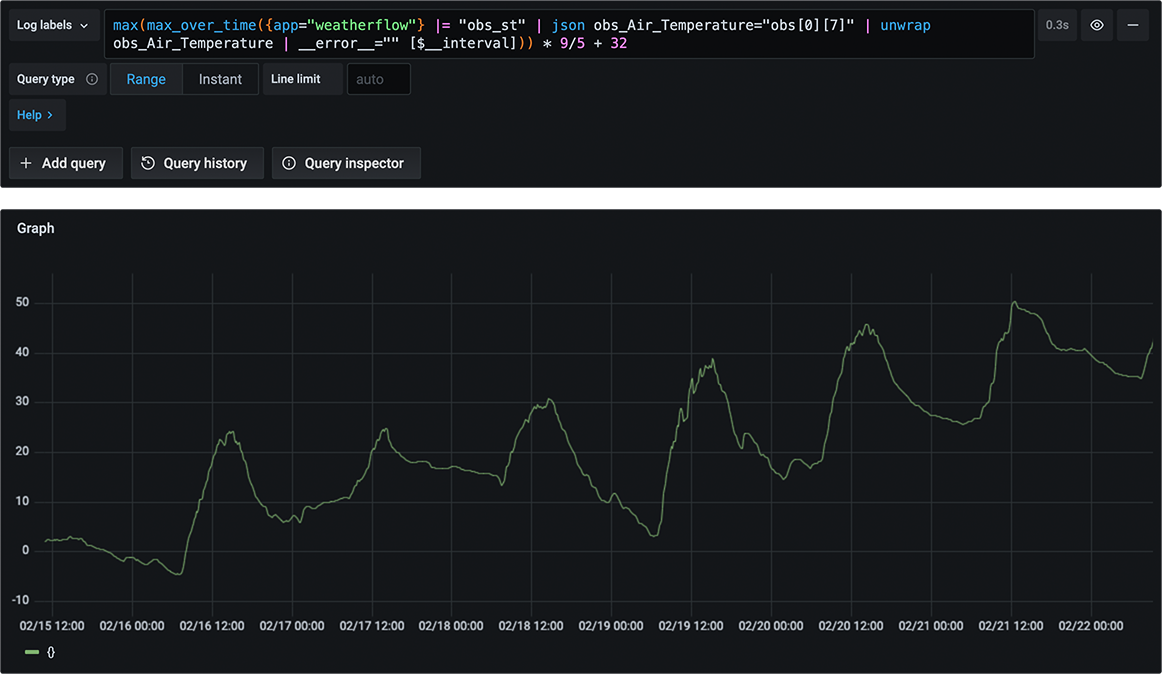
Using the WeatherFlow UDP API as a guide, I made metrics from each of the index values:
Observation Value Layout
| Index | Field | Units |
|---|---|---|
| 0 | Time Epoch | Seconds |
| 1 | Wind Lull (minimum 3 second sample) | m/s |
| 2 | Wind Avg (average over report interval) | m/s |
| 3 | Wind Gust (maximum 3 second sample) | m/s |
| 4 | Wind Direction | Degrees |
| 5 | Wind Sample Interval | seconds |
| 6 | Station Pressure | MB |
| 7 | Air Temperature | C |
| 8 | Relative Humidity | % |
| 9 | Illuminance | Lux |
| 10 | UV | Index |
| 11 | Solar Radiation | W/m^2 |
| 12 | Precip Accumulated | mm |
| 13 | Precipitation Type | 0 = none, 1 = rain, 2 = hail |
| 14 | Lightning Strike Avg Distance | km |
| 15 | Lightning Strike Count | |
| 16 | Battery | Volts |
| 17 | Report Interval | Minutes |
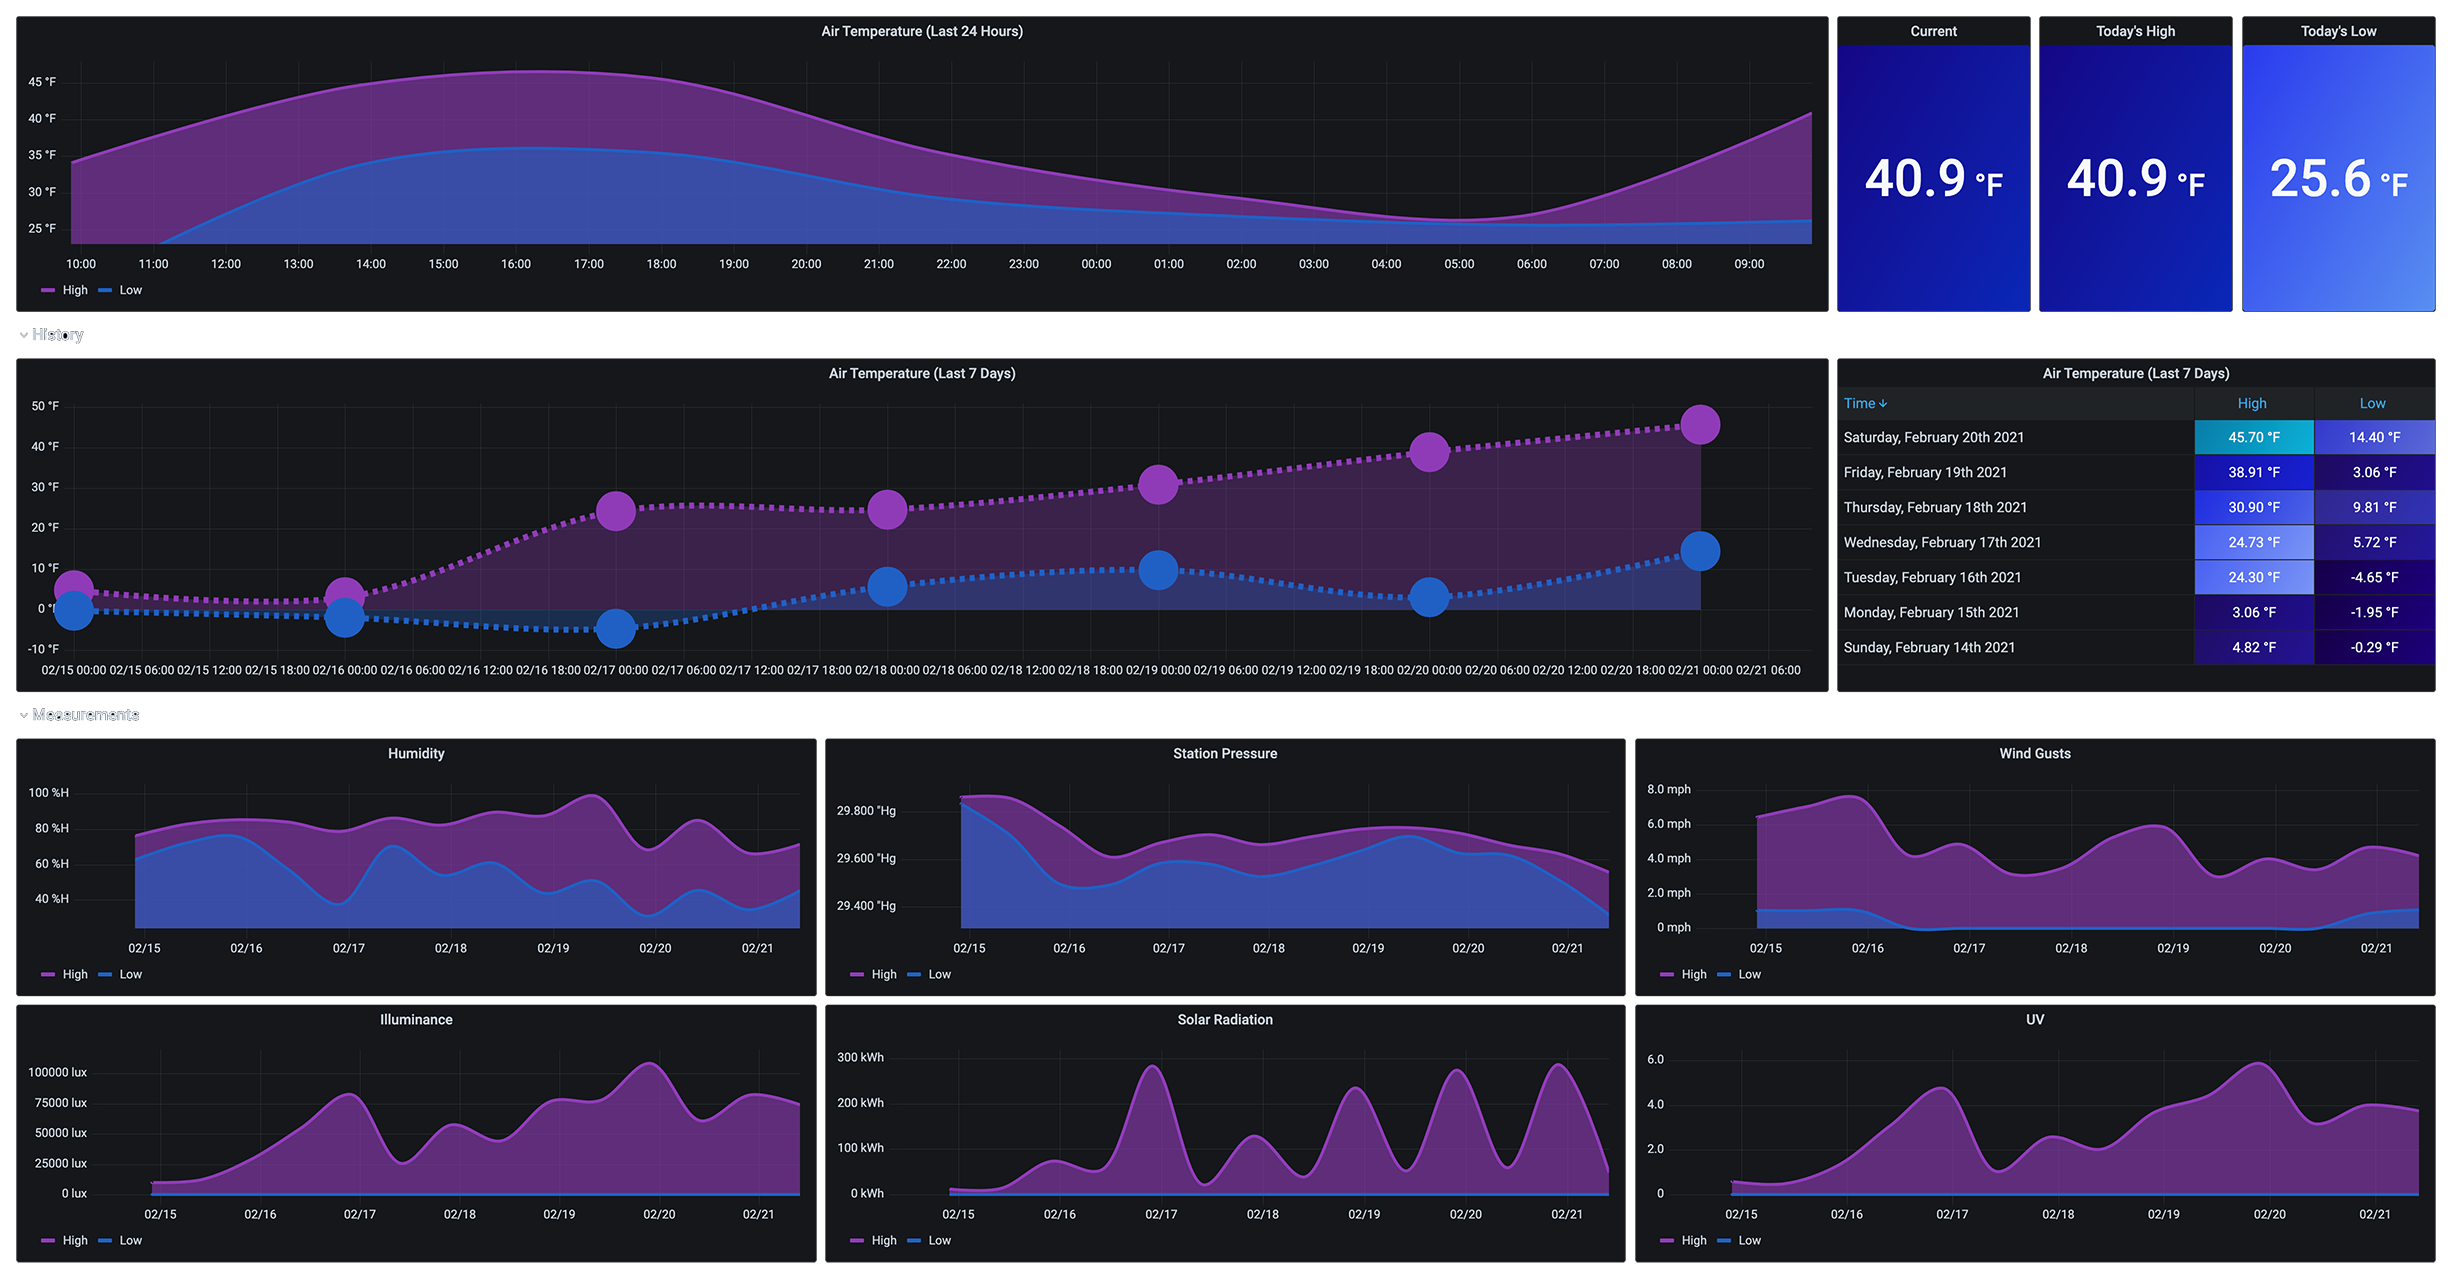
Grafana Dashboards
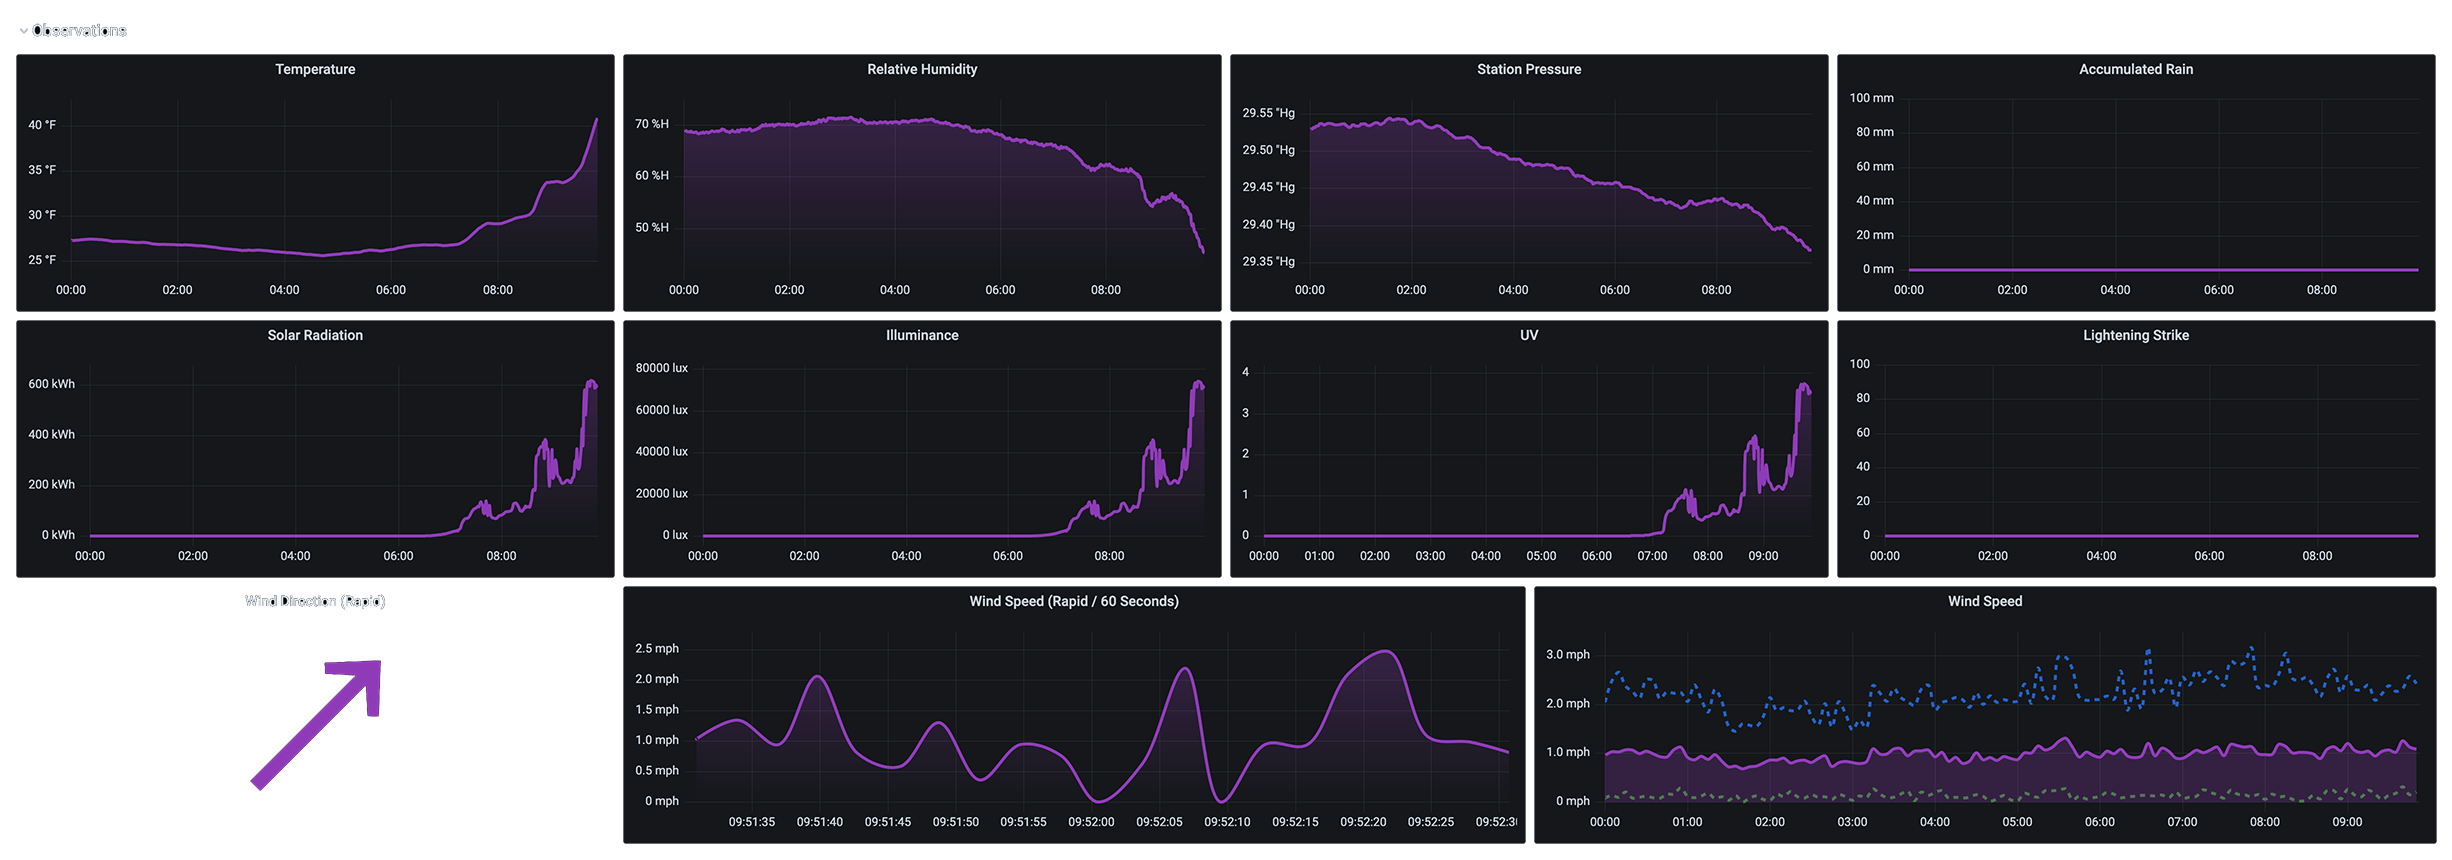
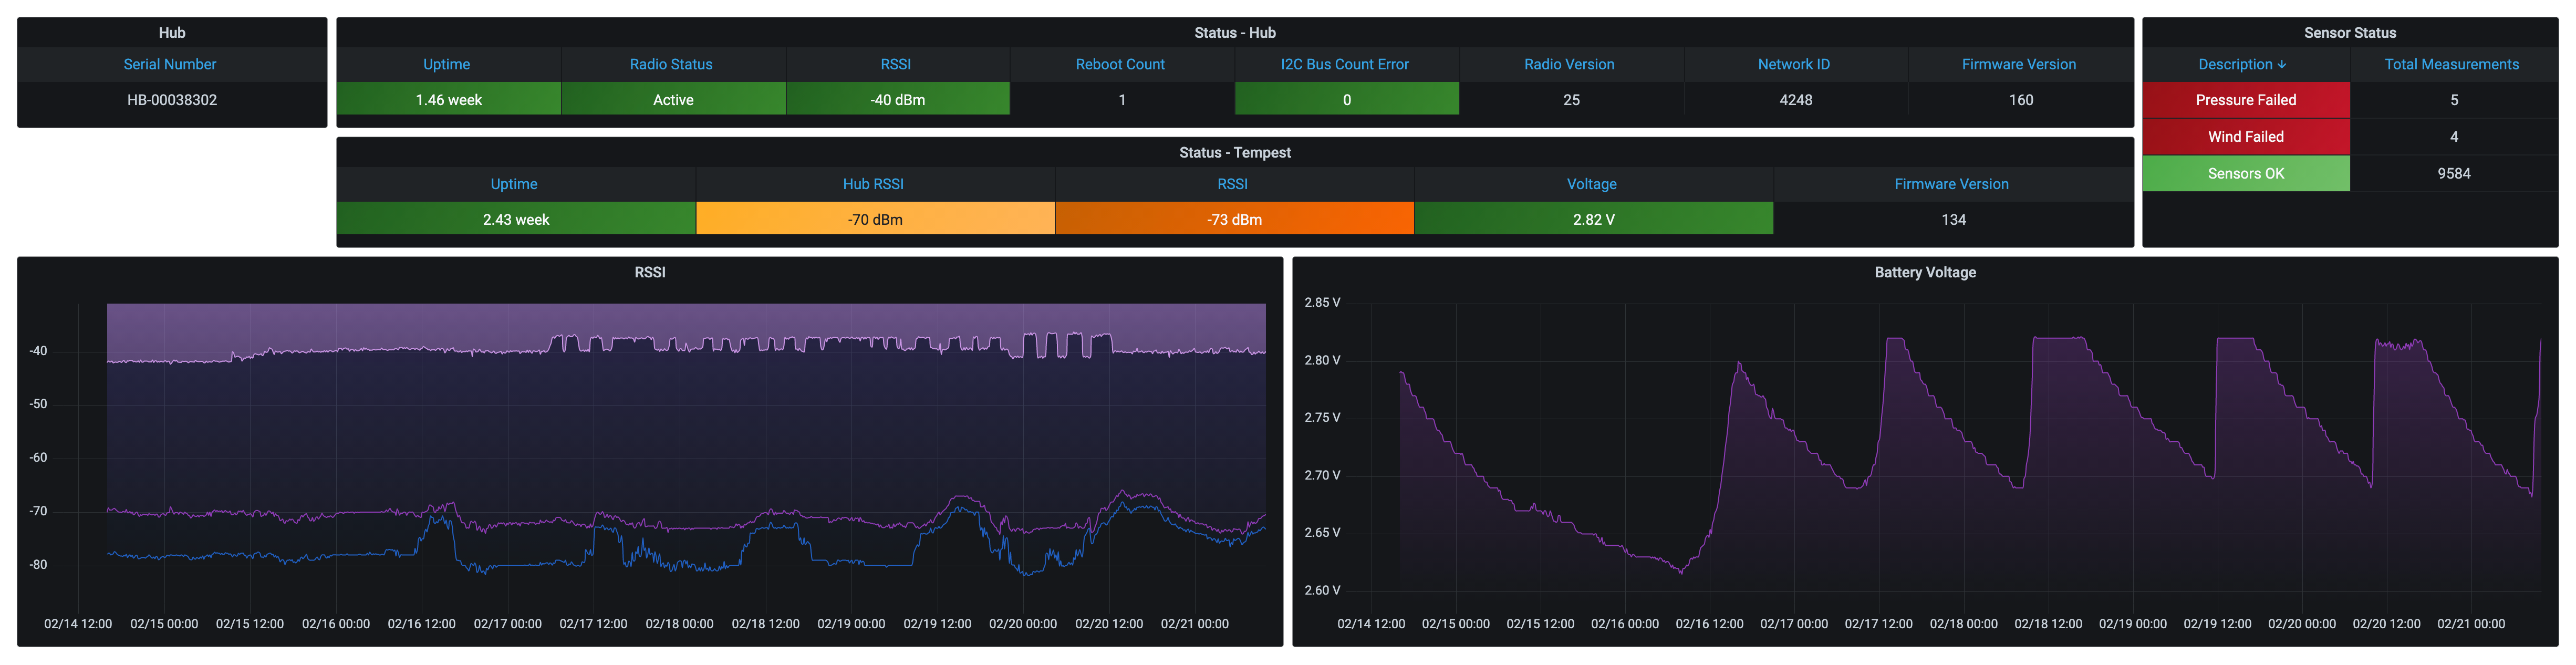
The rest of my efforts were turning those metrics into usable information – coming up with an Overview, Today So Far, and a Device Details set of Grafana dashboards.
Like my previous Loki Syslog All-In-One project – I created an All-In-One project for this WeatherFlow collector. Details on installing your own collector, including all the files needed to download, are over at my WeatherFlow Dashboards AIO Github repository. These dashboards are also available in Grafana’s Community Dashboards. With some help from P-Doyle’s Simple-WeatherFlow-Python-Listener and Promtail – you too can deploy a quick and easy WeatherFlow log collector with Grafana Loki and Grafana dashboards.
If you’re a WeatherFlow fan, I’d love any feedback on how this works. If you’d like to share your dashboards, I’d happily include them here to share with the community!
These dashboards are also part of my Internet-facing set of current Grafana dashboards. Enjoy!!