A Sense Energy Meter Collector and Grafana dashboarding project.
Collector Info – 14734
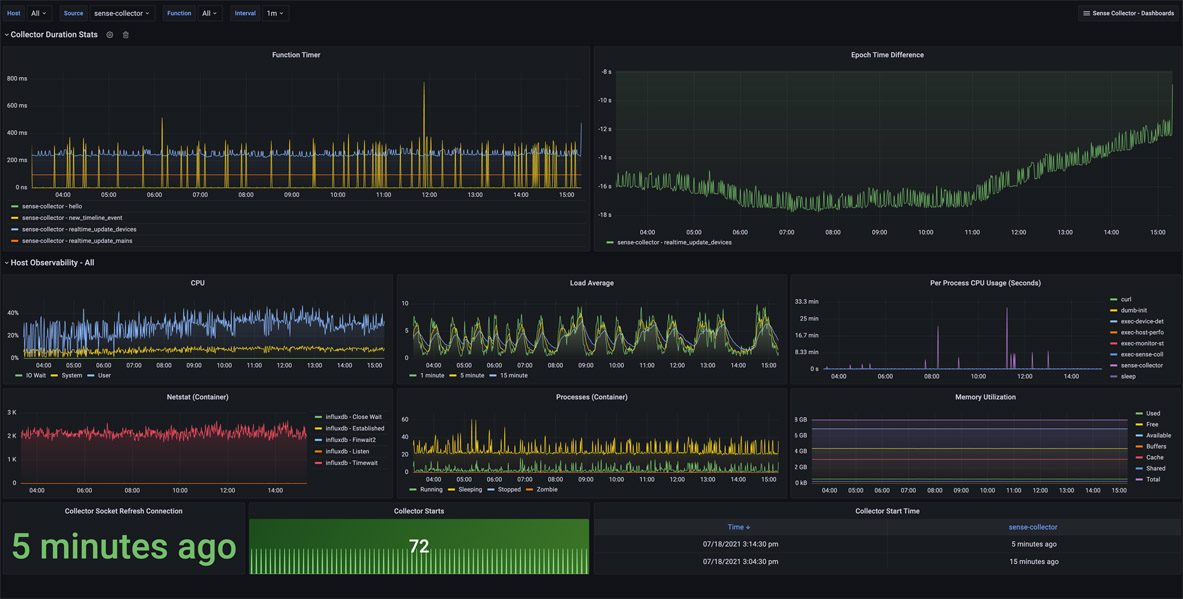
Collector Info: Provides observability into how the Sense Collector functions alongside metrics related to the host’s performance. This dashboard helps understand the main collector’s performance and assists with troubleshooting.
Epoch Time Difference: Helps determine if your hosts can keep up with processing messages from the Sense monitor. It provides the difference between the host and epoch times received in the Sense monitor data. Negative numbers mean the Sense monitor is ahead of the hosts. Positive numbers mean the host is behind the Sense monitor. If the drift trends to the positive, it may also mean there’s just time clock drift. Ensure you monitor the NTP time sync on both your host and Sense if there’s a large discrepancy.
CPU, Load Average, Memory Utilization: These panels show host-level details and are not specific to the performance of the docker container. Per Process CPU Usage, Netstat, and Processes are particular to the container.
Collector Starts: Provide the last time the container and process were started. The connection is reset every ten minutes because Sense times out the connection.
Device Overview – 14735
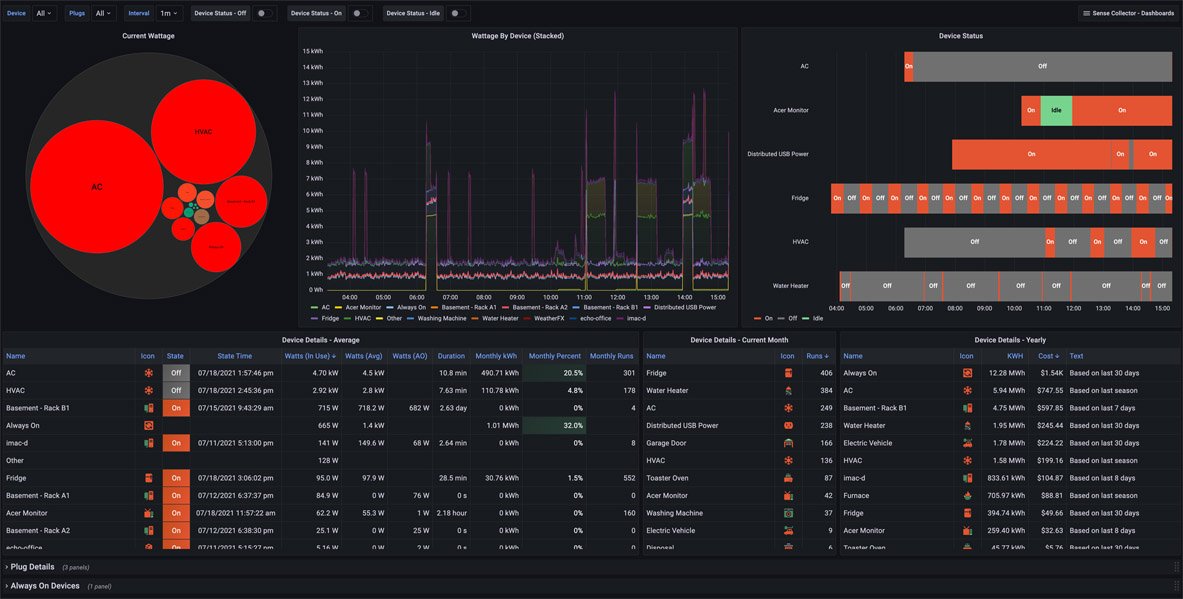
Device Overview is the main dashboard for Sense Collector. Here, you’ll see several sections about overall and detailed device details.
Current Wattage: A Bubble Chart showing current wattage usage by device. Larger circles represent higher wattage consumption.
Wattage By Device (Stacked): Wattage overtime per device. The graph is stacked to represent total household wattage.
Device Status: This is a State Timeline representing event data from the Sensor Monitor over time. It currently represents three states: On, Off, and Idle.
Device Details – Average: A table view of current data representing the current state, state time, watts in use, average, and always on makeup. Average duration, monthly kWh, percent, and the number of runs are also listed. This table defaults to be sorted by “Watts (In Use).”
Device Details – Current Month: Shows the number of runs per device since the start of the current month.
Device Details – Yearly: Shows calculated kWh and costs for each device. The text next to each device details how the costs are calculated. For example, “Based on the last 30 days,” “Based on the last seven days,” or “Based on last season.”
Plug Details: If you have any of the Sense-compatible smart plugs, they will also be listed here. Open up this row to display Volts and Amps measured by each plug. There’s another measurement (Who Knows By Plugs), but I don’t know what it does yet.
Always On Devices: This shows which devices the Sense monitor detected to have an Always On wattage component. This may differ from the actual wattage and tends to update less frequently.
Notice: This Grafana dashboard uses the community visualization Bubble Chart panel plugin. It hasn’t been updated for quite some time and won’t work out of the box with current versions of Grafana due to plugin signing requirements. Configuration changes on your Grafana instance will be needed to load this plugin.
Mains Overview – 14736
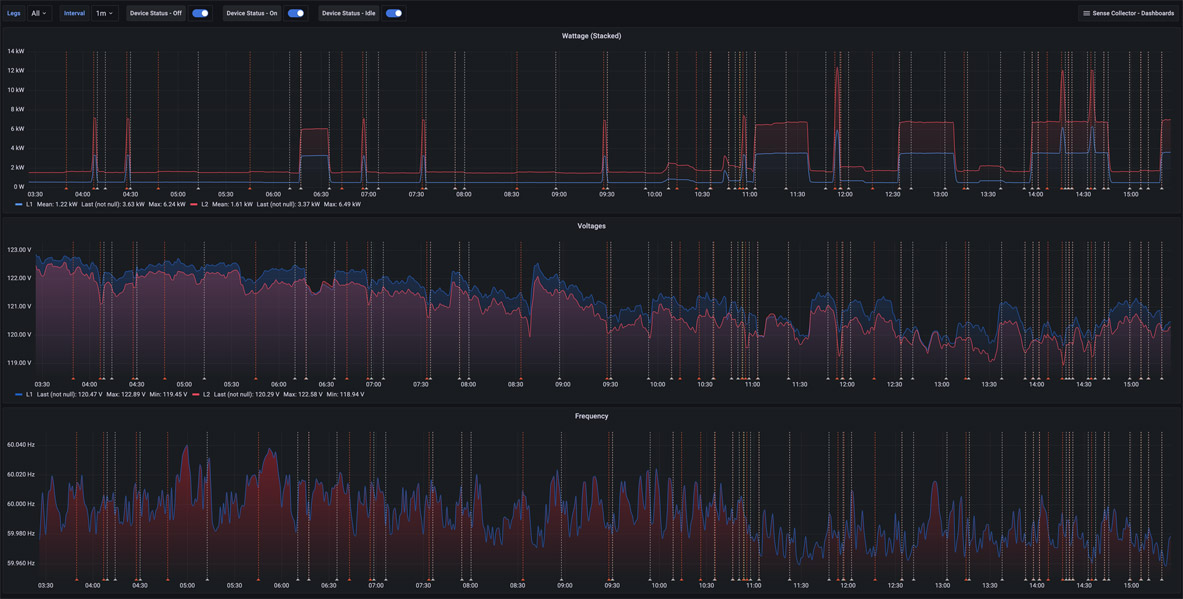
Mains Overview provides three panels showing Wattage (Stacked), Voltages, and Frequency. Dropdowns at the top of the dashboard show Leg 1, Leg 2, or both together. Device Status On, Off, and Idle event annotations may be toggled on or off.
Monitor & Detection – 14737
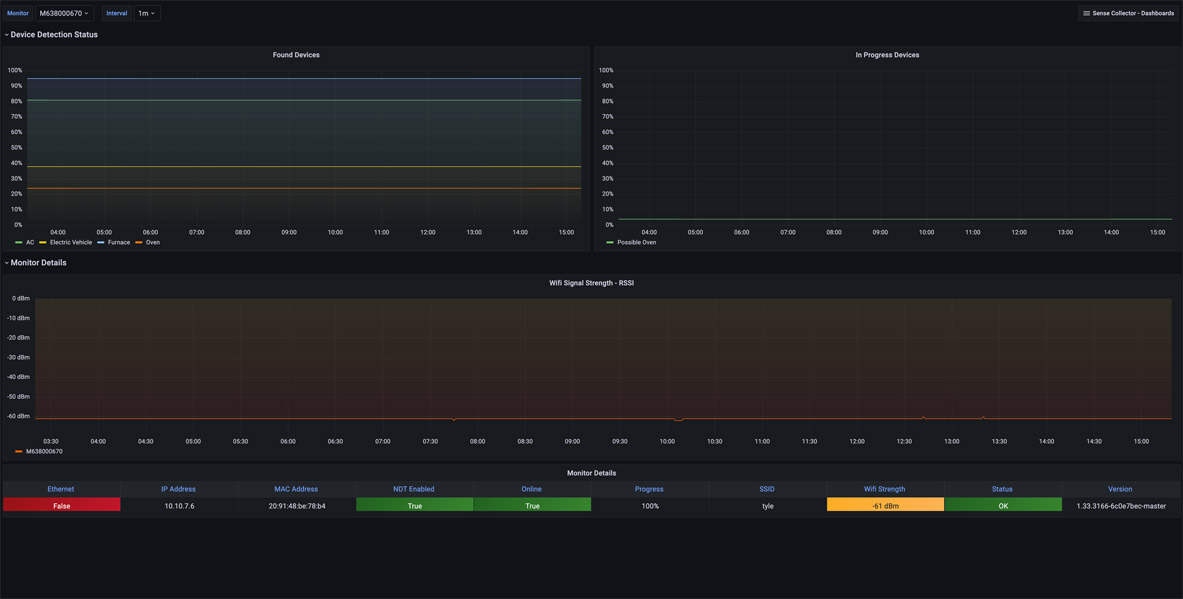
The Monitor & Detection dashboard provides observability of the monitor itself.
Device Detection Status: Represents Device Detection Status for both “Found” and “In Progress” devices.
WiFi Signal Strength – RSSI: Represents the WiFi signal strength of your Sense monitor.
Monitor Details: This panel shows current information about Online status, General Status, Learning Progress, IP Address, MAC Address, WiFi SSID, WiFi strength, Ethernet, NDT Enabled, and software version.