An All-In-One WeatherFlow logging and dashboarding project.
Blog Posts
GitHub Projects:
Current Conditions
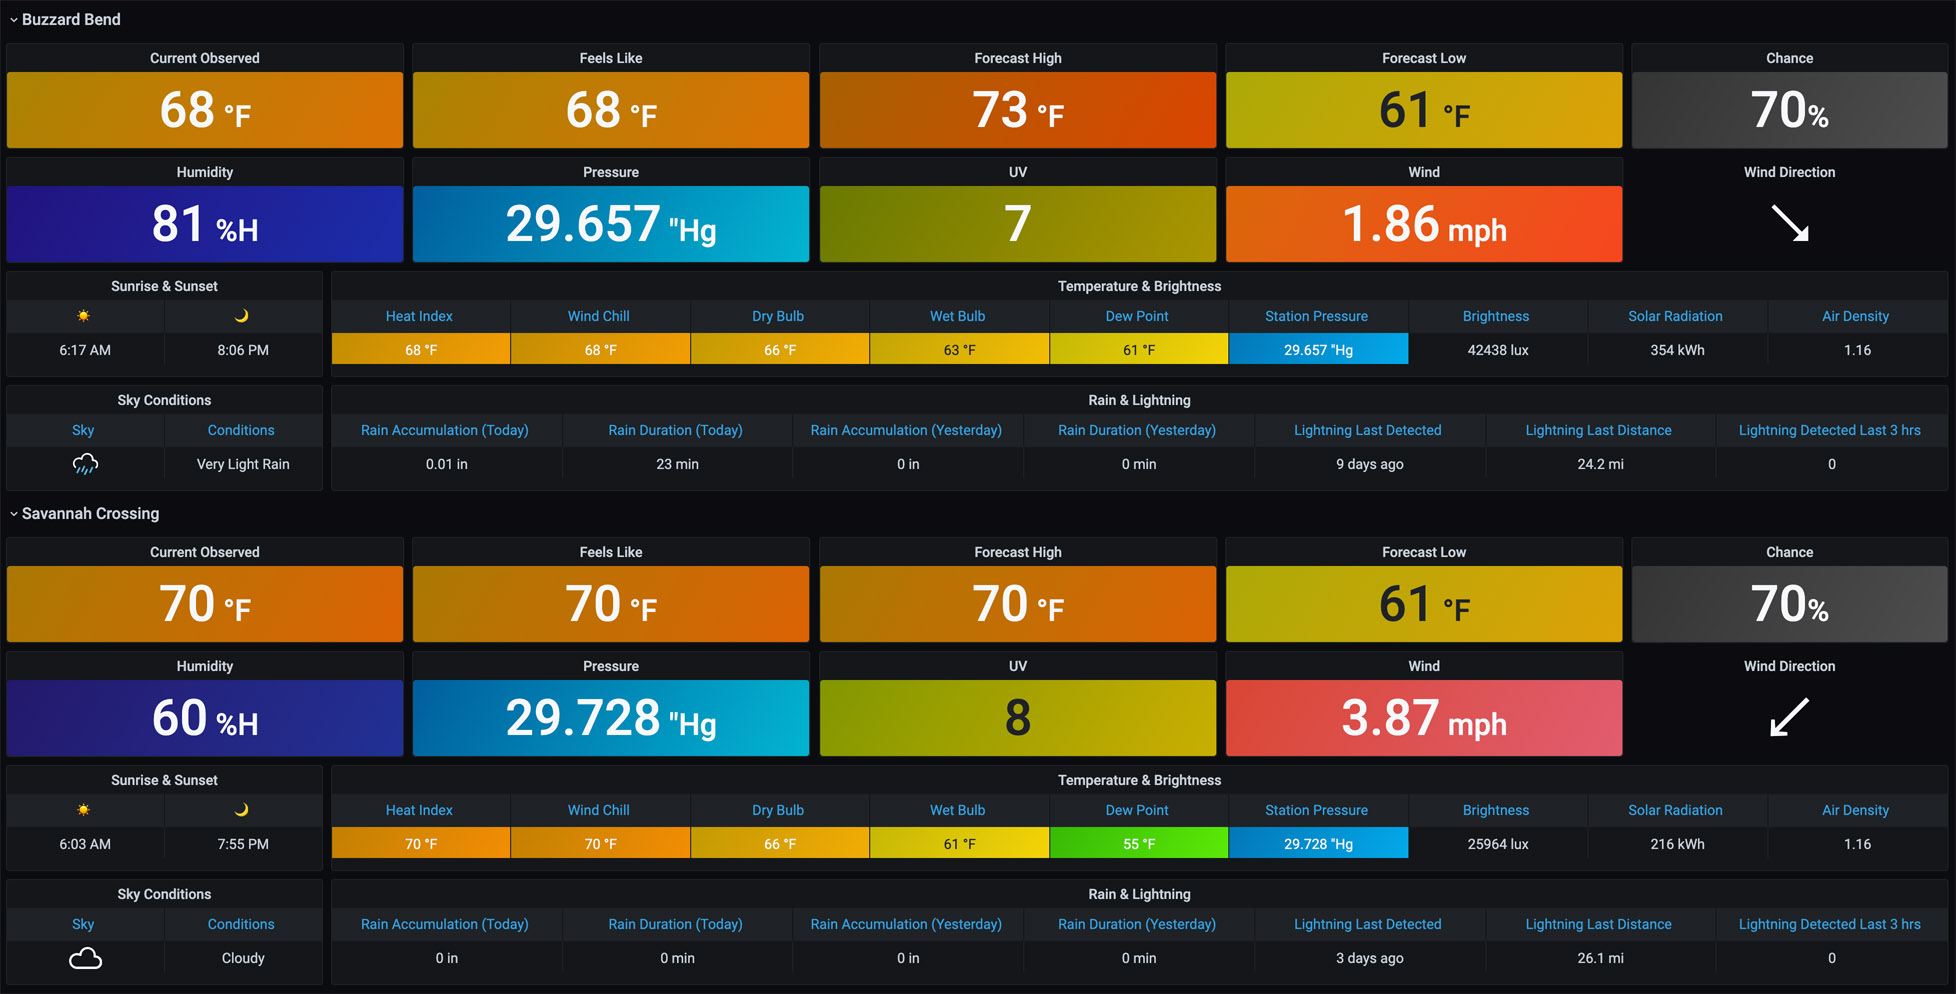
This dashboard provides a comprehensive overview of your station location, combining all “at-a-glance” metrics from your WeatherFlow device. The current conditions dashboard is divided into the following:
- Temperature & Wind: observed, feels like, forecast high and low, the chance of precipitation, humidity, sea level pressure, UV, wind speed, and direction.)
- Sunrise & Sunset and Sky Conditions
- Temperature & Brightness: Heat index, wind chill, dry bulb, wet bulb, dew point, station pressure, brightness, solar radiation, and air density.
- Rain & Lightning: Rain accumulation (today and yesterday), rain duration (today and yesterday), lightning last detected, last distance, and the number of lightning detections during the previous 3 hours.
Device Details
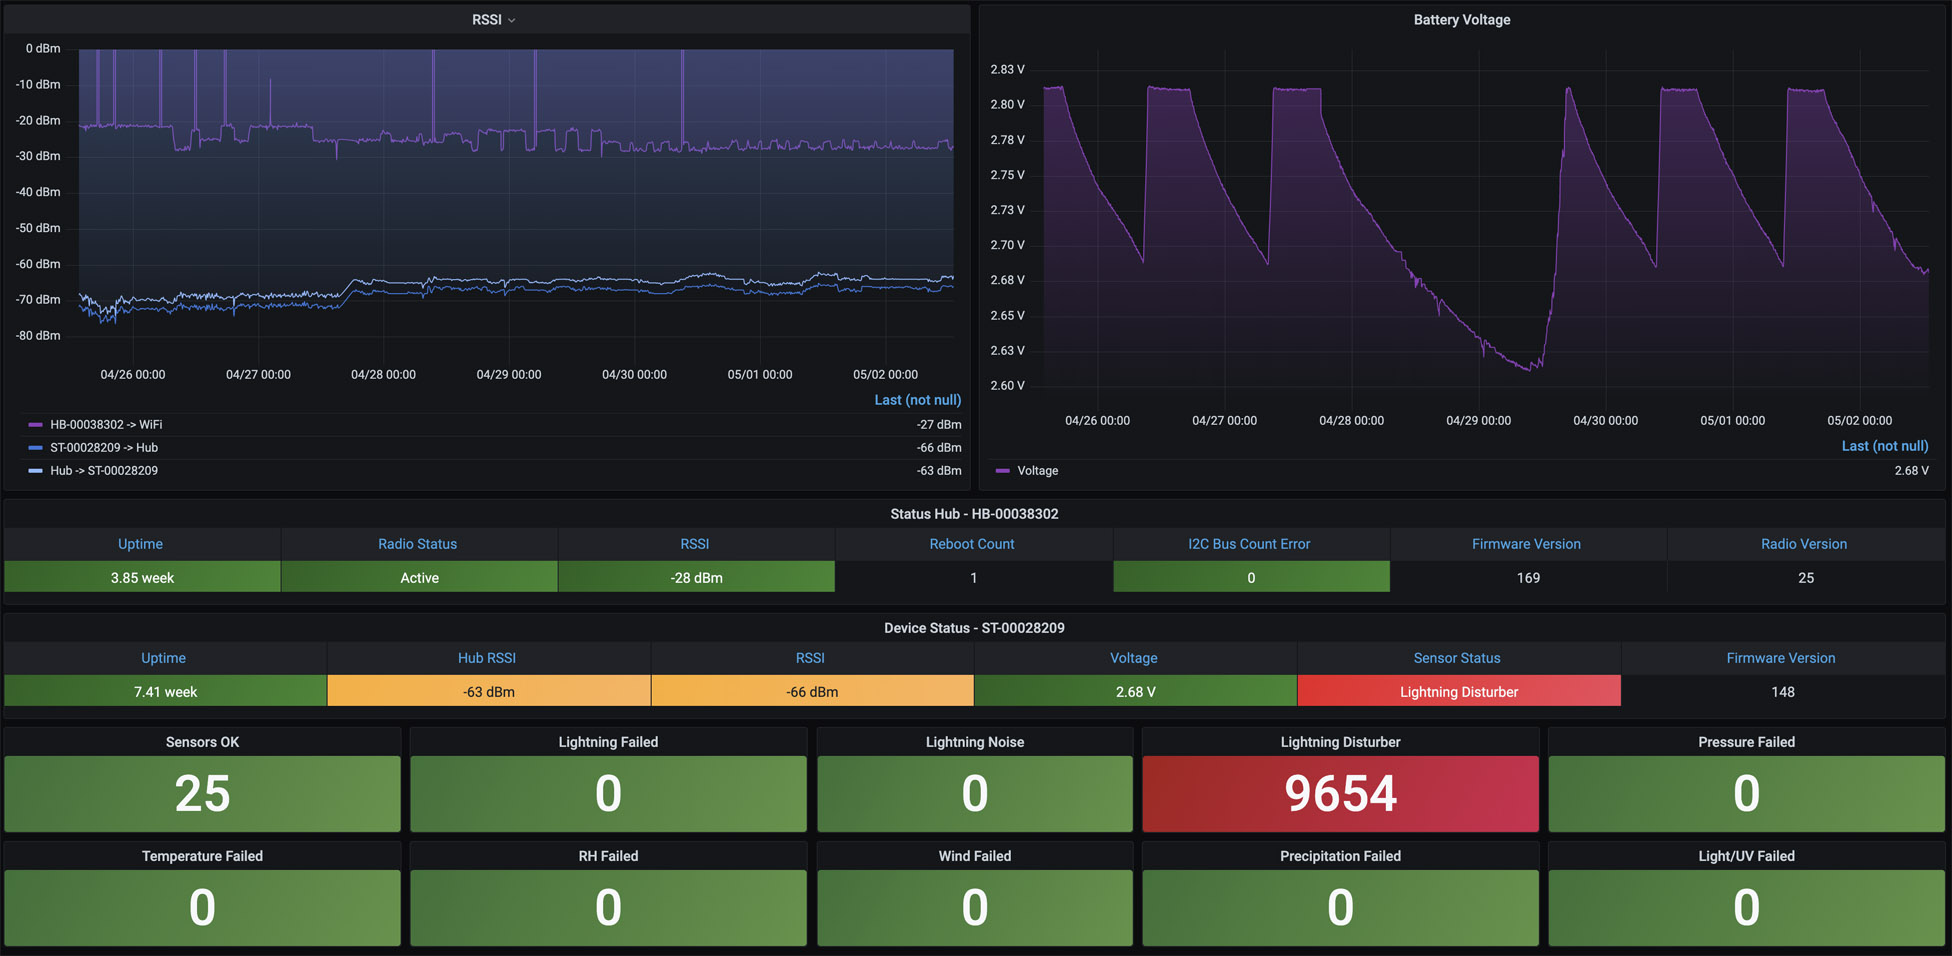
This dashboard provides the current status for the Tempest and your WeatherFlow hubs, such as Uptime, Radio Status, RSSI, Reboot Count, I2C Bus Count Error, Radio Version, Network ID, Firmware Version, and Voltage.
RSSI and Battery Voltage over time defaulted to the last seven days are shown at the top of the dashboard, while current device details are shown below.
Sensor Status measurements are shown with a number related to each per-minute collection from the device. Either “Sensors OK” is down or any failures, which sensor had the error. Note that if you have the Lightning Disturber enabled, you may see many failures as electromagnetic interference is being suppressed.
Forecast
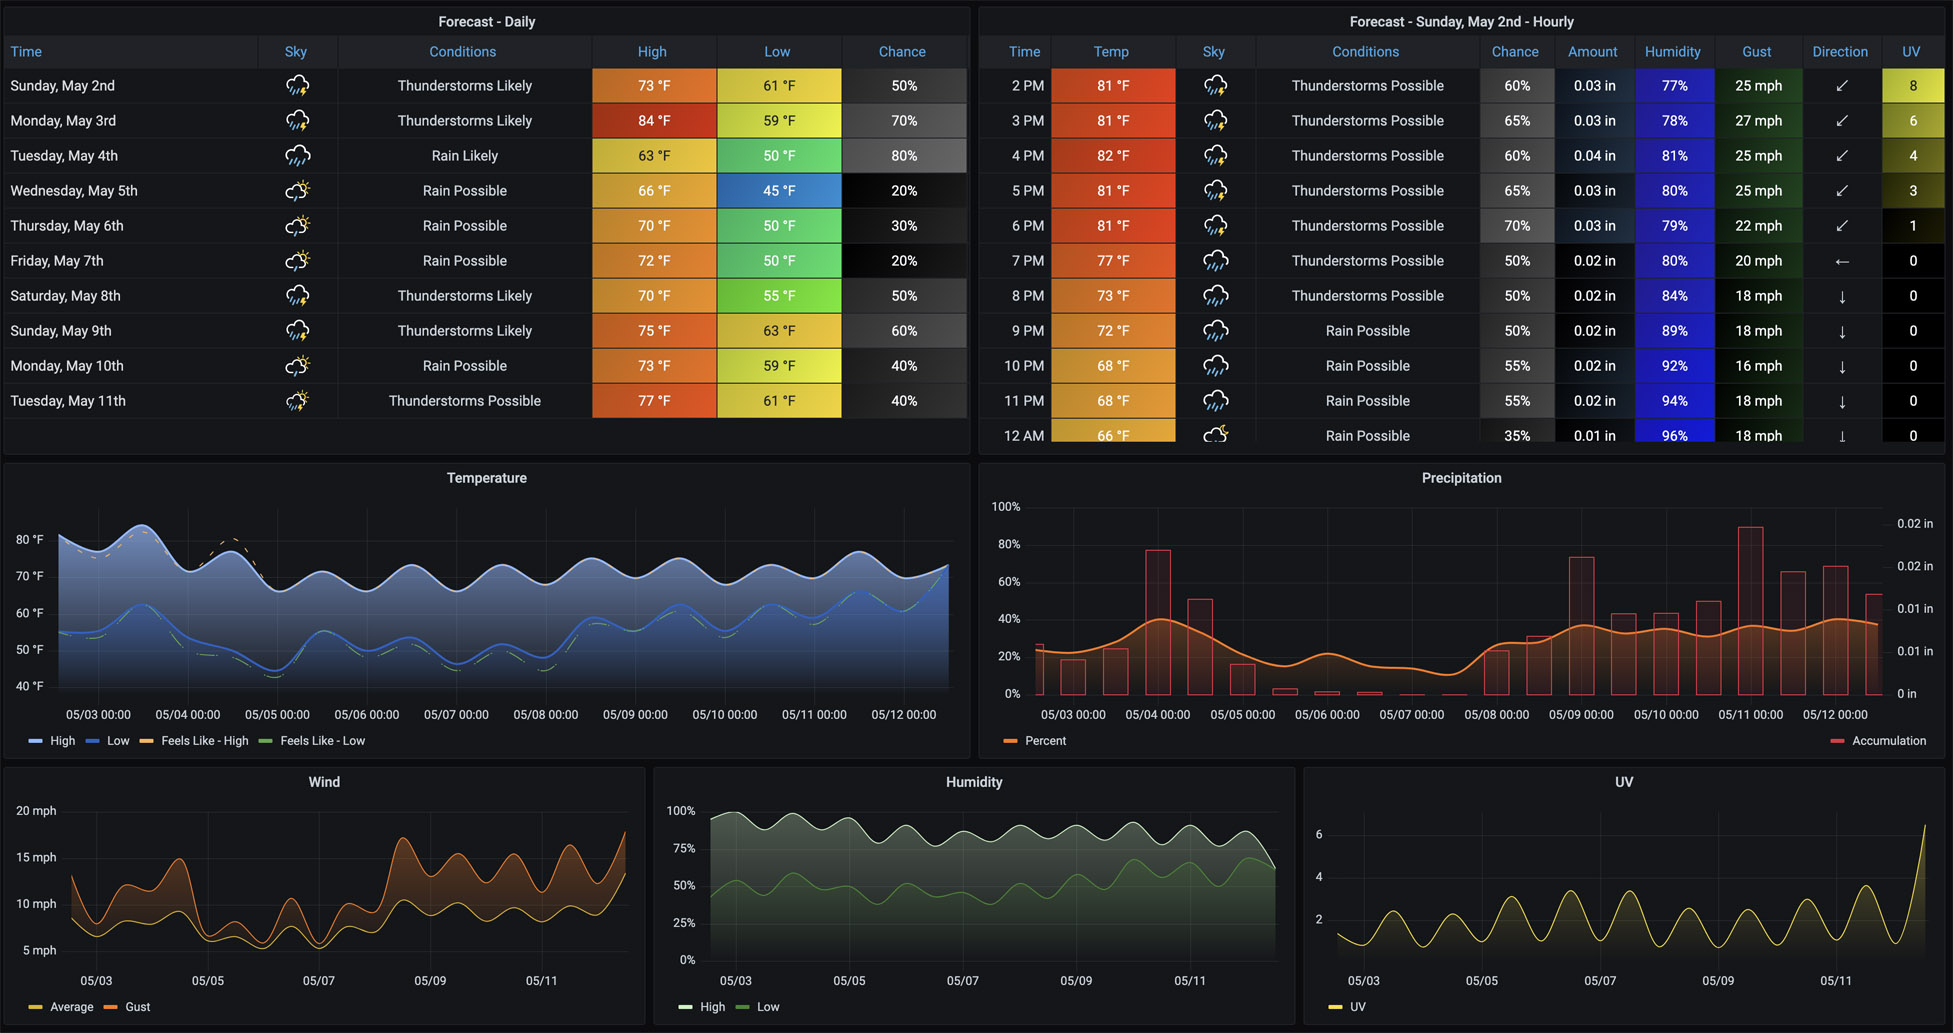
A daily and hourly forecast in table format with charts below them. The default time range includes the current day and nine upcoming days. The interval drop-down at the top defaults to 12 hours to provide for highs and lows forecasts. Clicking on any of the dates in the “Forecast – Daily” table will refresh the Forecast hourly table to that day’s hourly forecasts. This can also be done from the top “Forecast Day” drop-down menu.
Forecast Vs. Observed
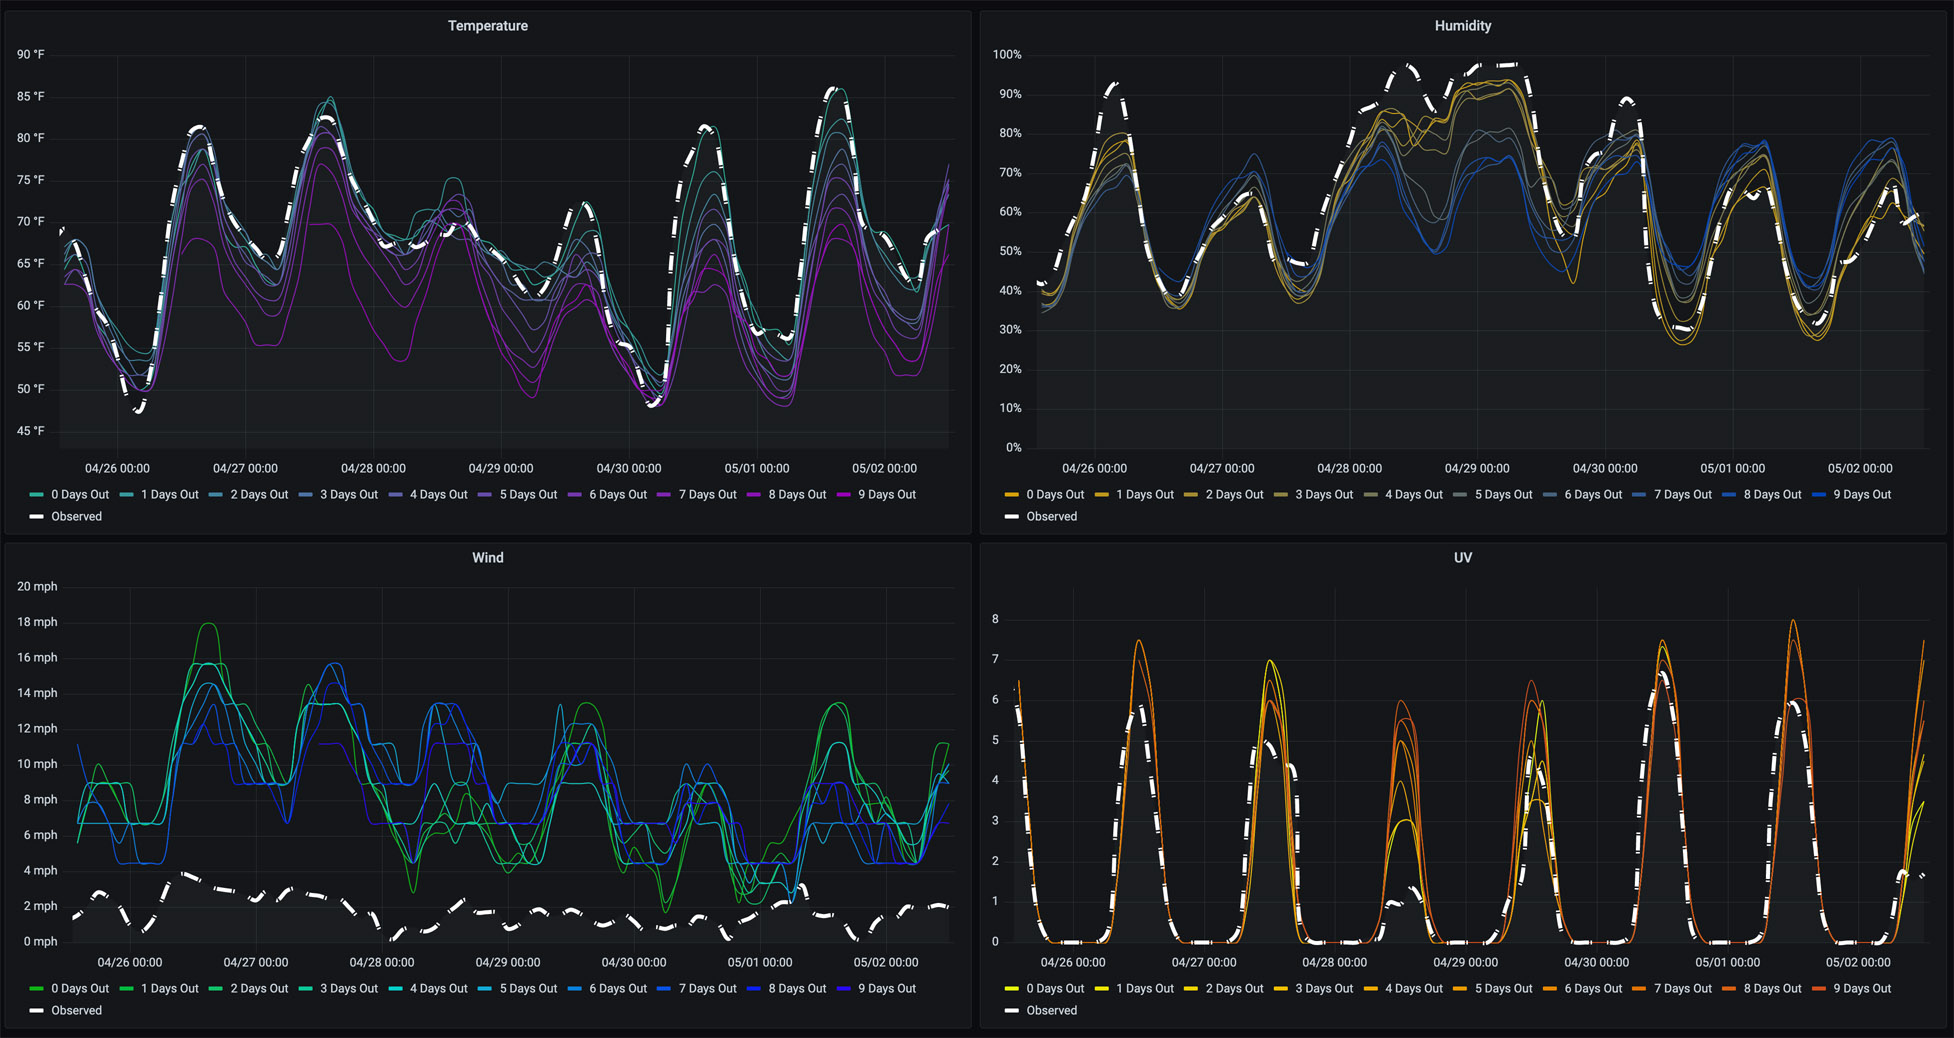
As forecast data is collected, this dashboard may be used to compare what was forecasted (by how many days out) versus the observed metric from your WeatherFlow device. Temperature, Humidity, Wind, and UV measurements are covered here. By default, “All” available forecast days are overlayed over the observed metric. You can choose “Days Out” from the top drop-down menu to compare individual forecasts.
Historical (local-udp)
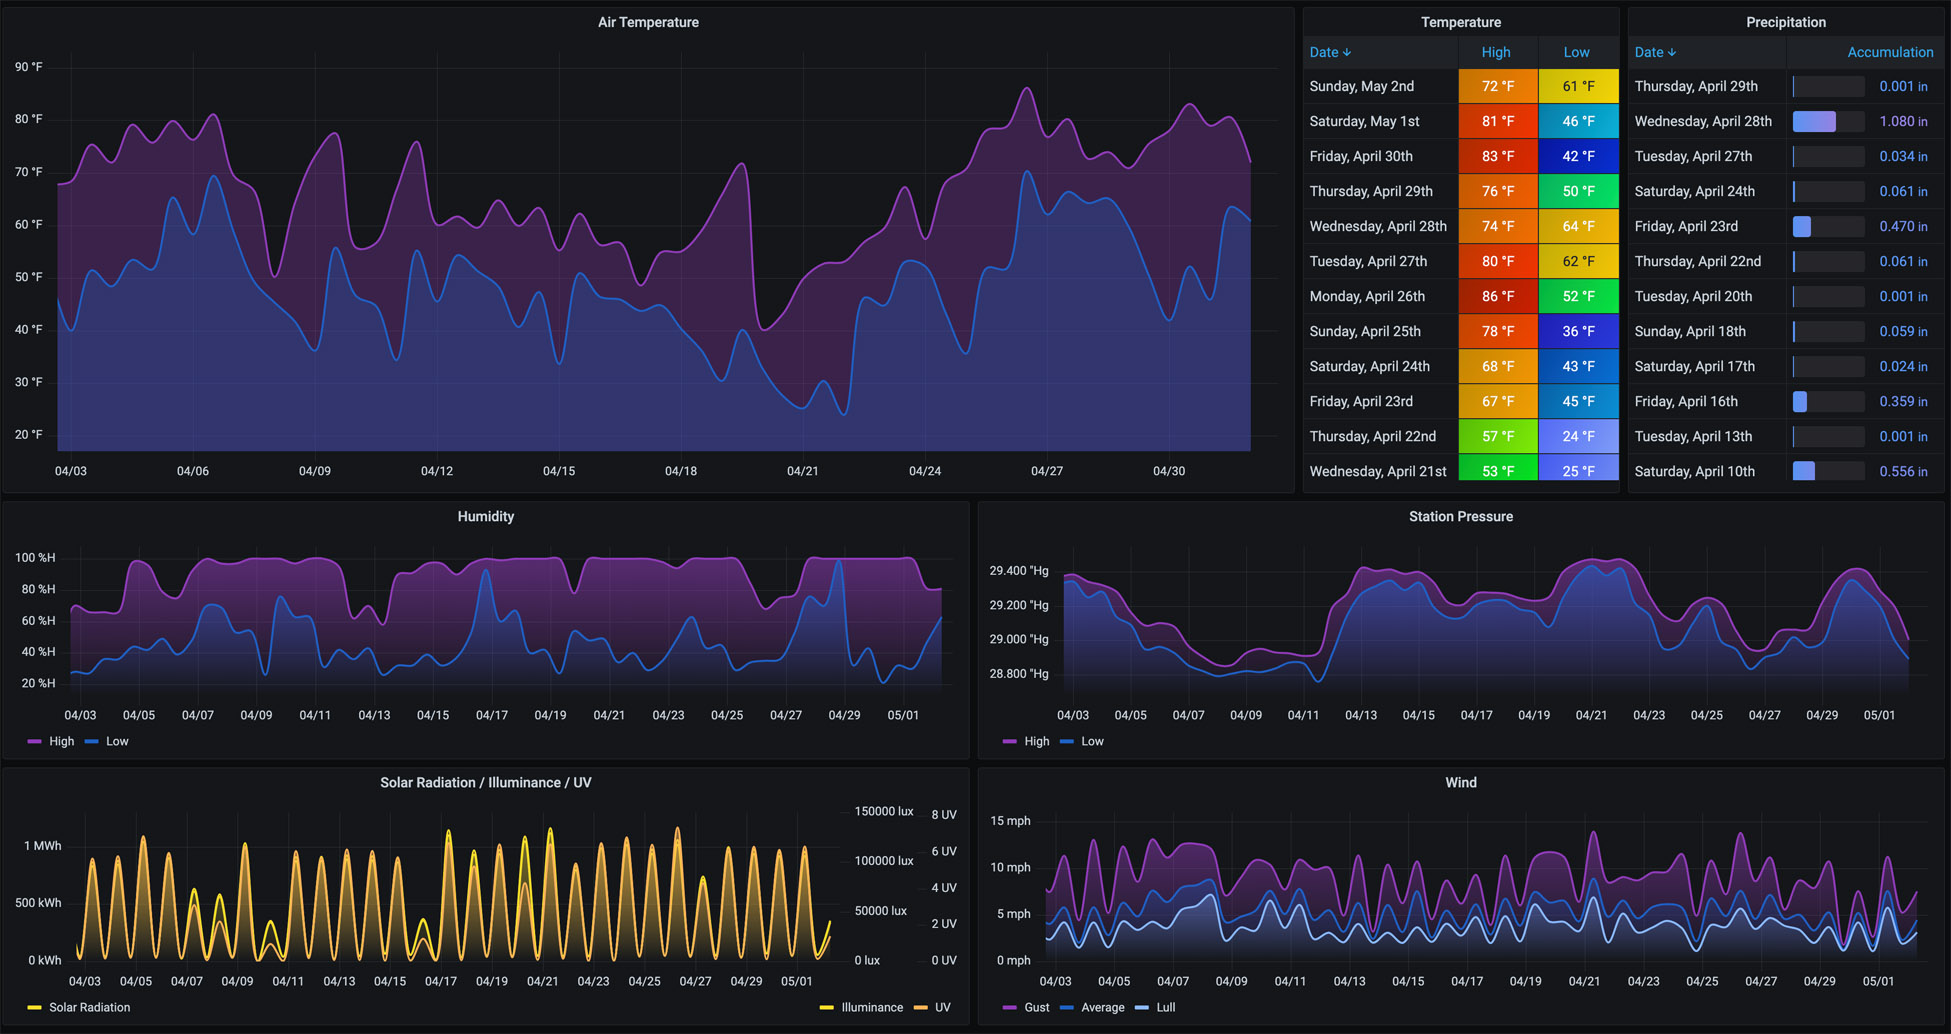
It provides a place to view weather details over more extended periods. It defaults to 30 days with a 12-hour interval to show highs and lows for each Air Temperature, Humidity, Station Pressure, Solar, and Wind metrics. Precipitation Accumulation is displayed for any day that precipitation is detected.
Historical (remote)
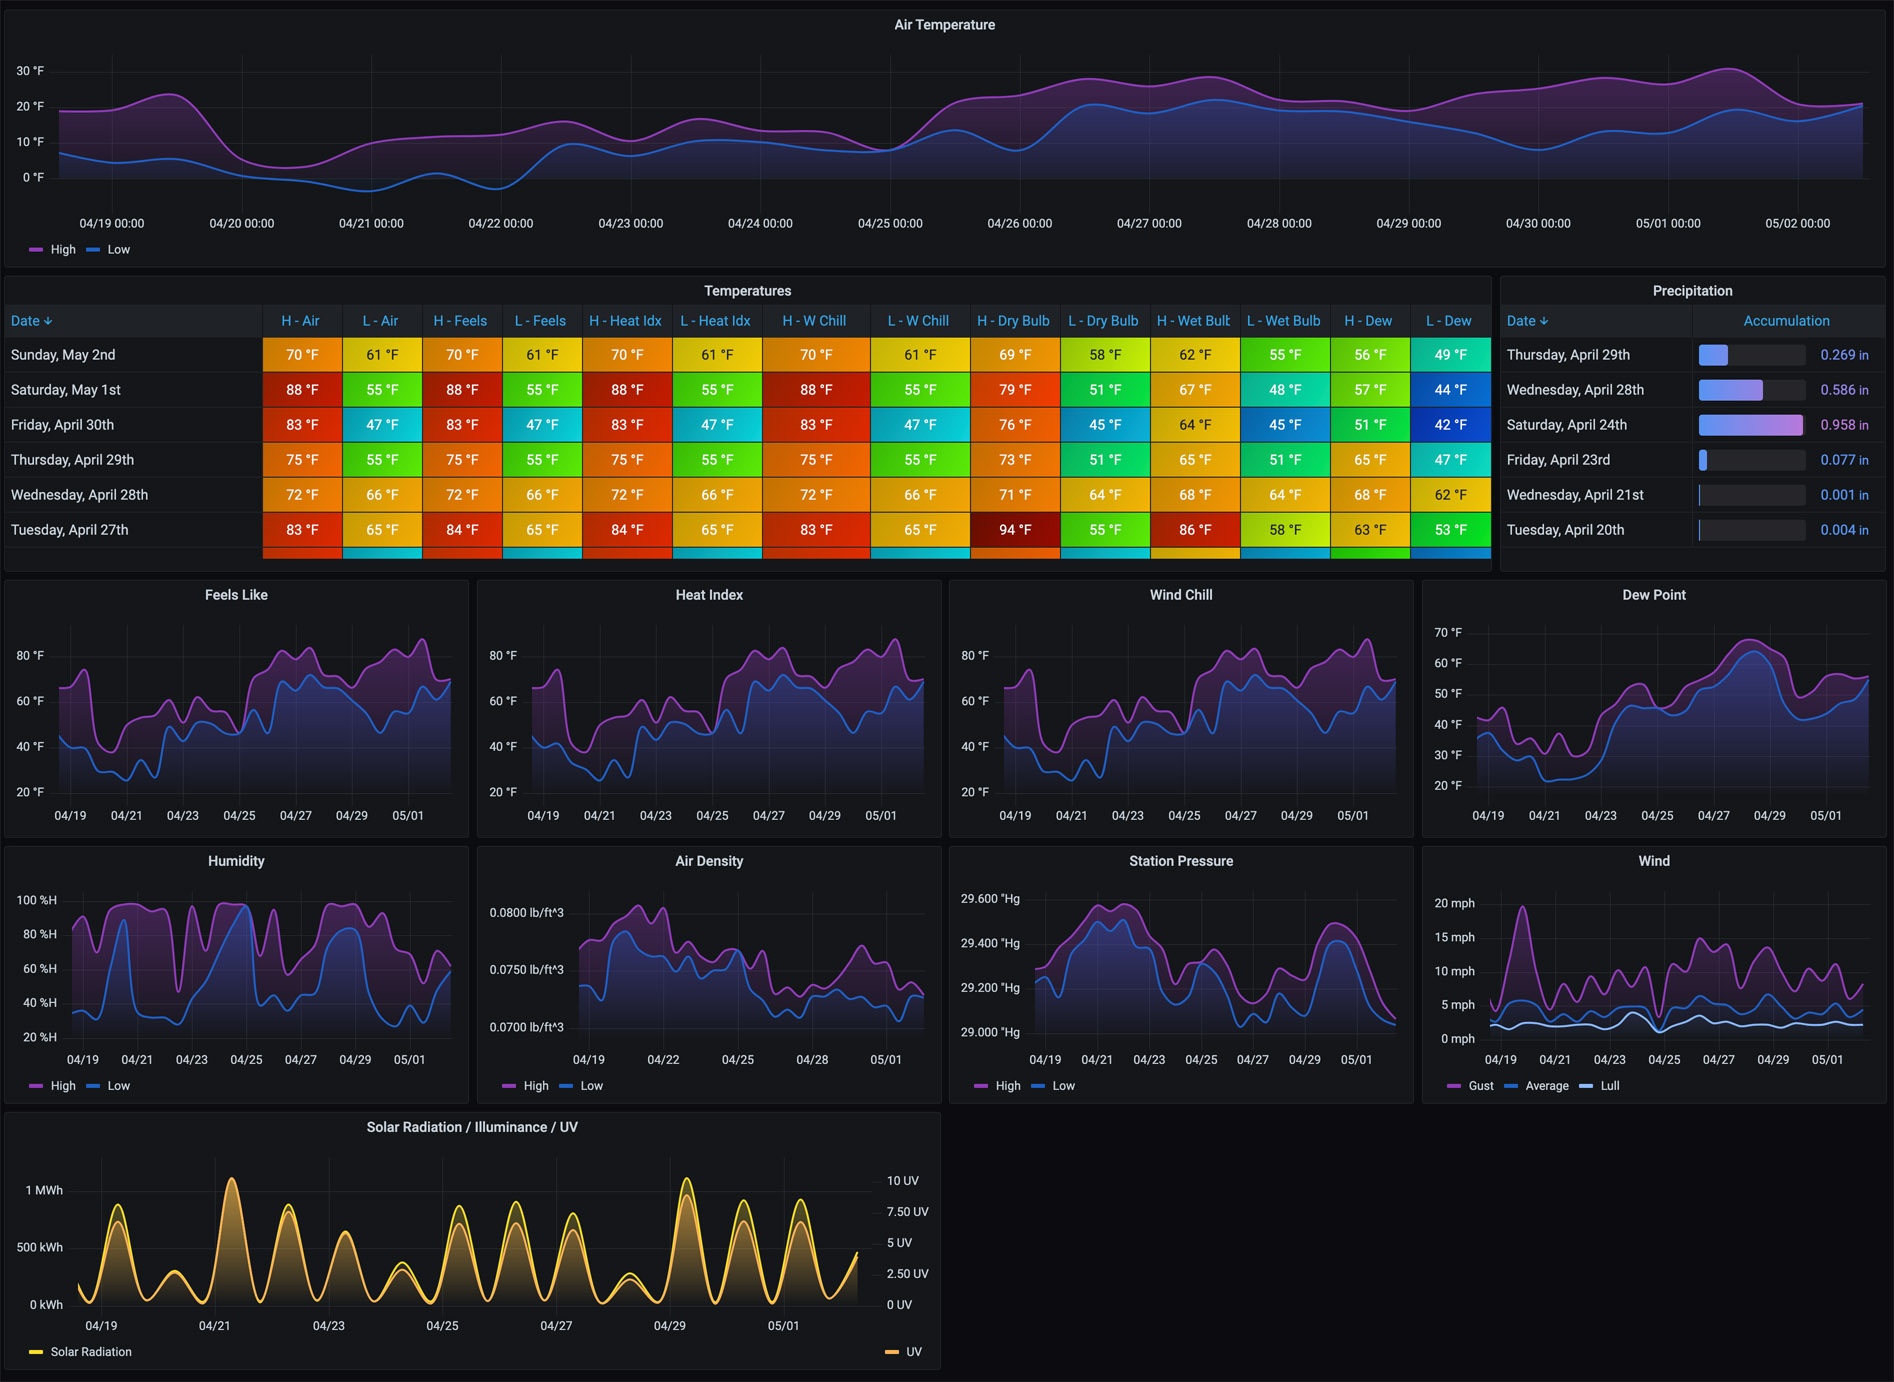
It provides a place to view weather details over longer periods. It defaults to 30 days with a 12-hour interval to show highs and lows for each Air Temperature, Humidity, Station Pressure, Solar, and Wind metrics. It also includes derived metrics, such as Feels Like, Heat Index, Wind Chill, Dry Bulb, Wet Bulb, and Dew Point. Precipitation Accumulation is displayed for any day that precipitation is detected.
Overview
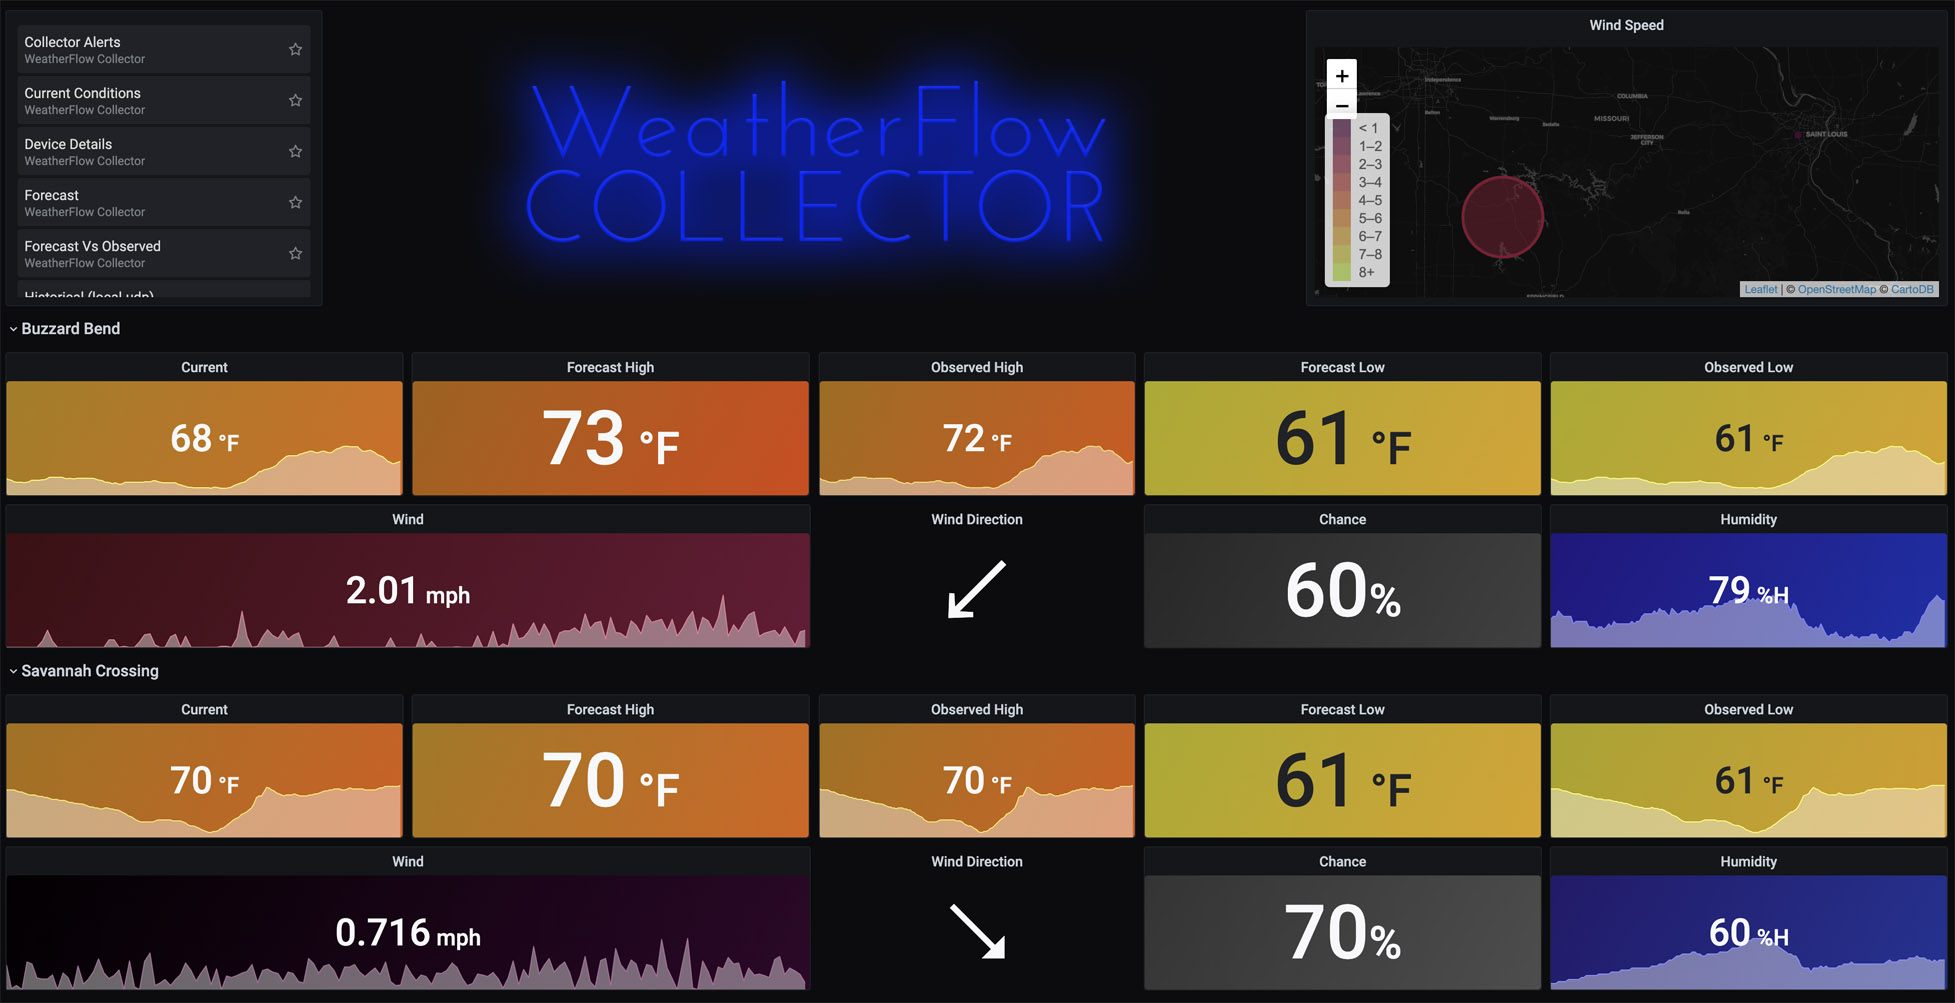
Overview is the default landing page for the WeatherFlow Collector AIO. It provides an overview of current weather metrics and live updates on wind and direction. You can choose other dashboards from the top right-hand dashboard panel or the top left-hand side drop-downs under “WeatherFlow Collector Dashboards.”
Rain and Lightning
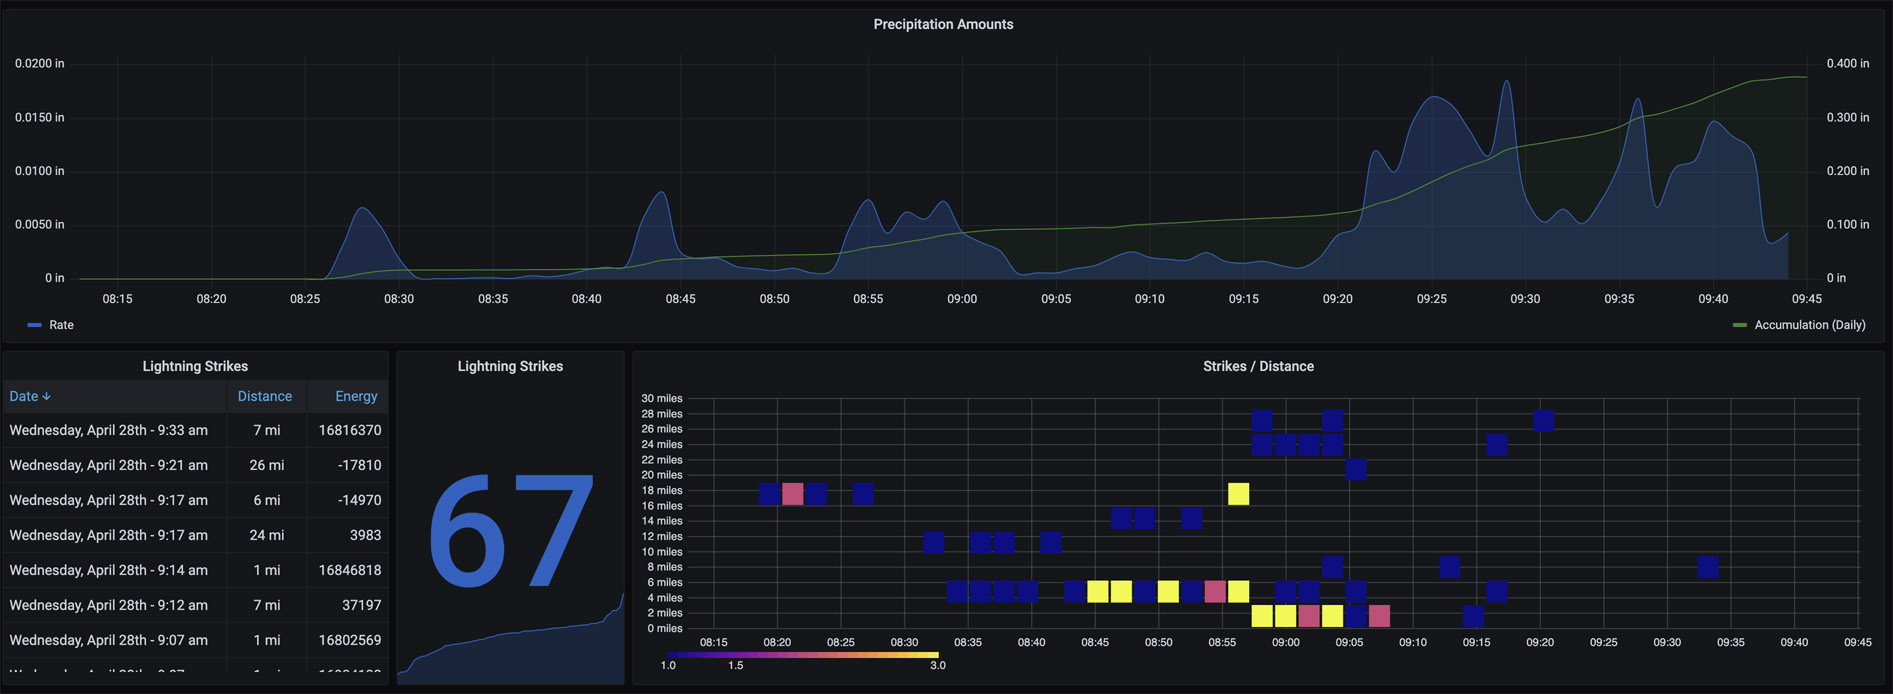
A historical view (defaulted to seven days) shows the precipitation rate and daily accumulation. As you zoom into the specific precipitation events, change the Interval drop-down to smaller increments (up to 1-minute collections) for finer rates.
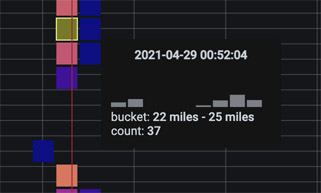
For lightning, strikes and distance are shown in a heat map visualization. Time is across the x-axis, while the number of detected lightning strikes is bucketed by color (dark blue to yellow). The Y-axis shows the bucketed distances (up to 40 miles away). Hover over each square for a histogram of each strike/distance count.
System Stats
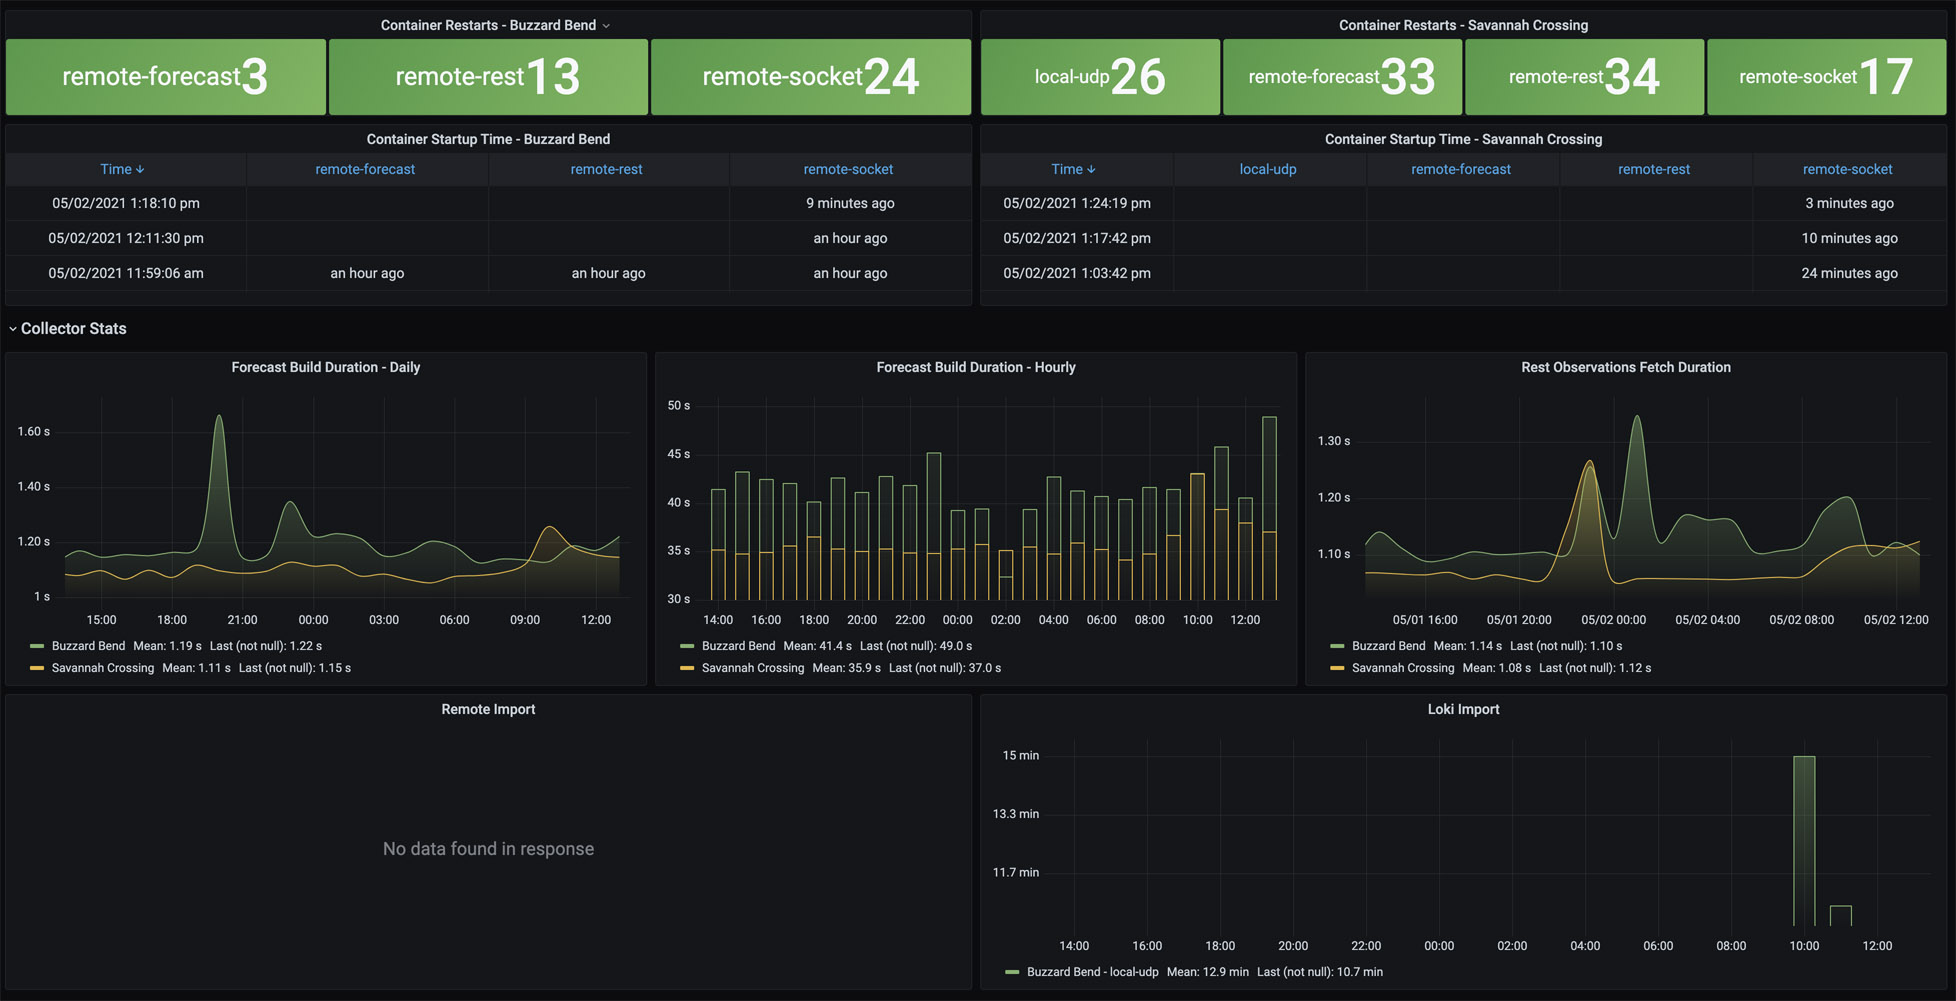
It provides two different system metrics to help you understand the health of your weatherflow collector. The top shows which container is running and each time it last started. A default Docker health check is enabled for each container that requires some data to be received and persisted every 60 seconds, or the container is marked unhealthy. This check happens every 5 seconds and will restart the container after three failed checks.
The second section shows how long it takes to receive and persist forecasts and observations.
- Forecast Build Duration – Daily: between 1 and 2 seconds
- Forecast Build Duration – Hourly: between 30 and 45 seconds (note – if this takes longer than 60 seconds, the Docker Health Check will currently recycle the container. A future update will change this to take a longer build duration into account. For now – set the “WEATHERFLOW_COLLECTOR_DOCKER_HEALTHCHECK_ENABLED” environmental variable to “false.”
- Rest Observations: between 1 and 2 seconds
Today So Far (local-udp)
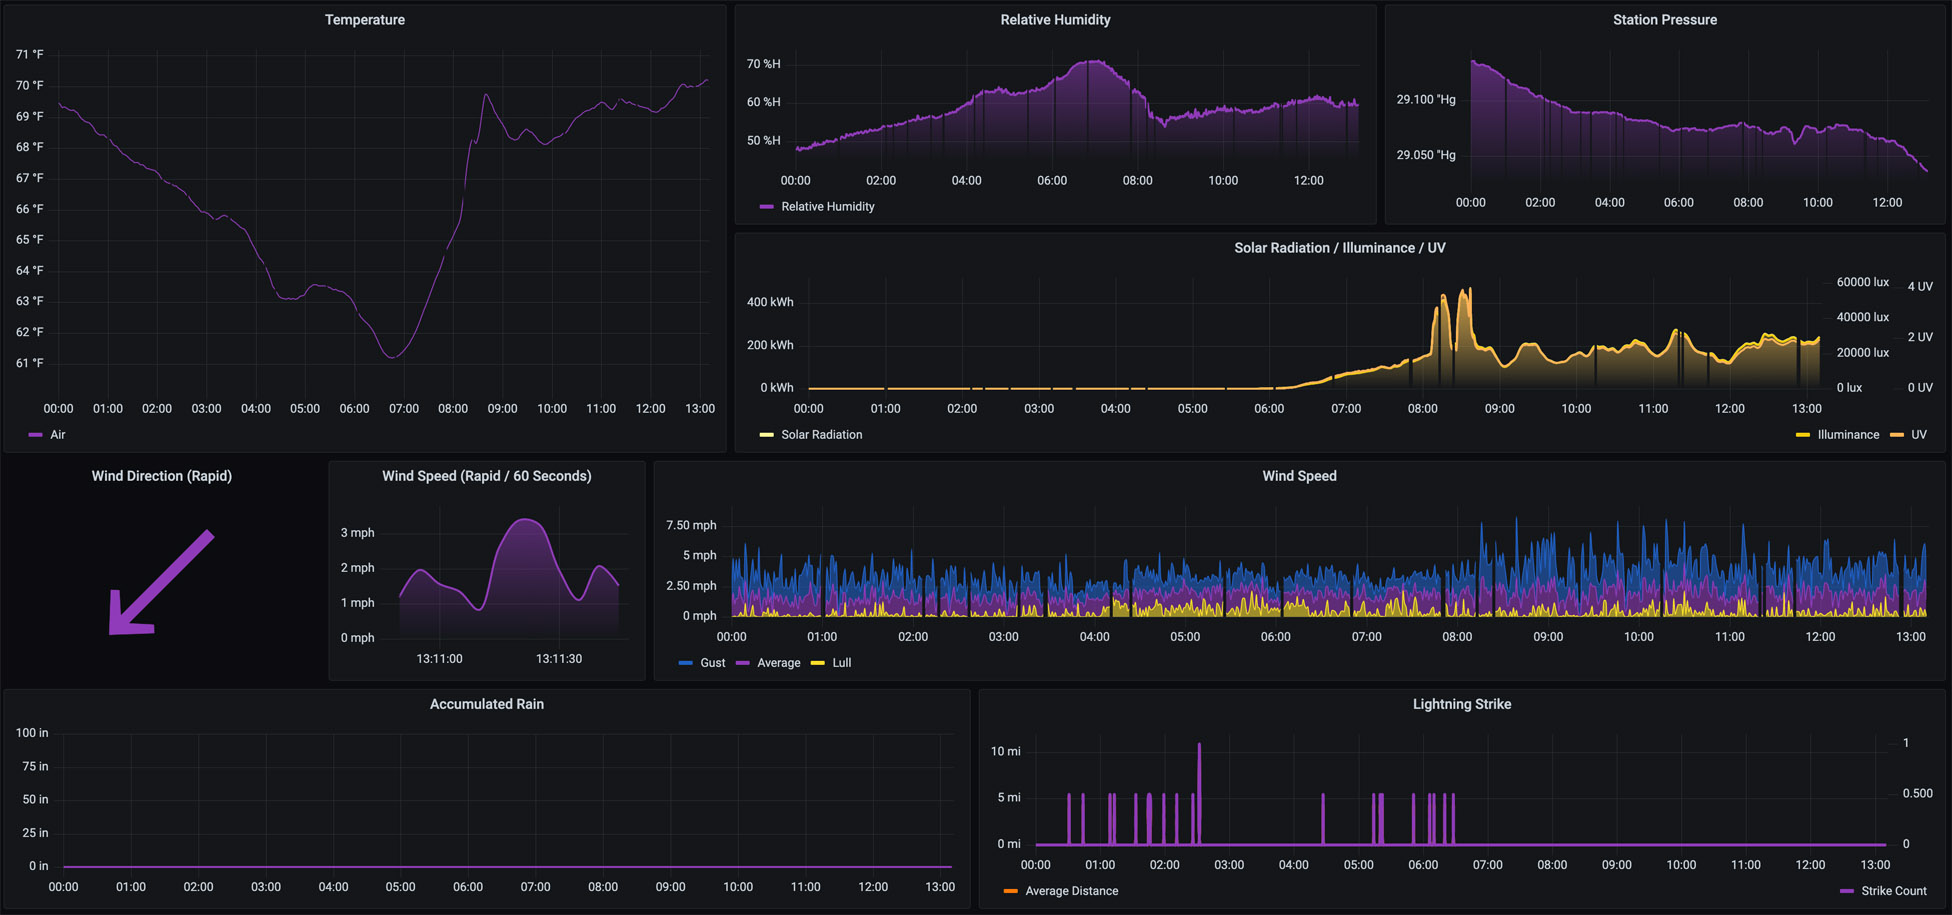
The dashboard provides for Temperature, Relative Humidity, Station Pressure, Accumulated Rain, Solar Radiation, Illuminance, UV, Lightning Strike, and Wind Speed from midnight to the current time. These reflect the direct measurements from the local-udp collector (or imported from WeatherFlow).
Today So Far (remote)
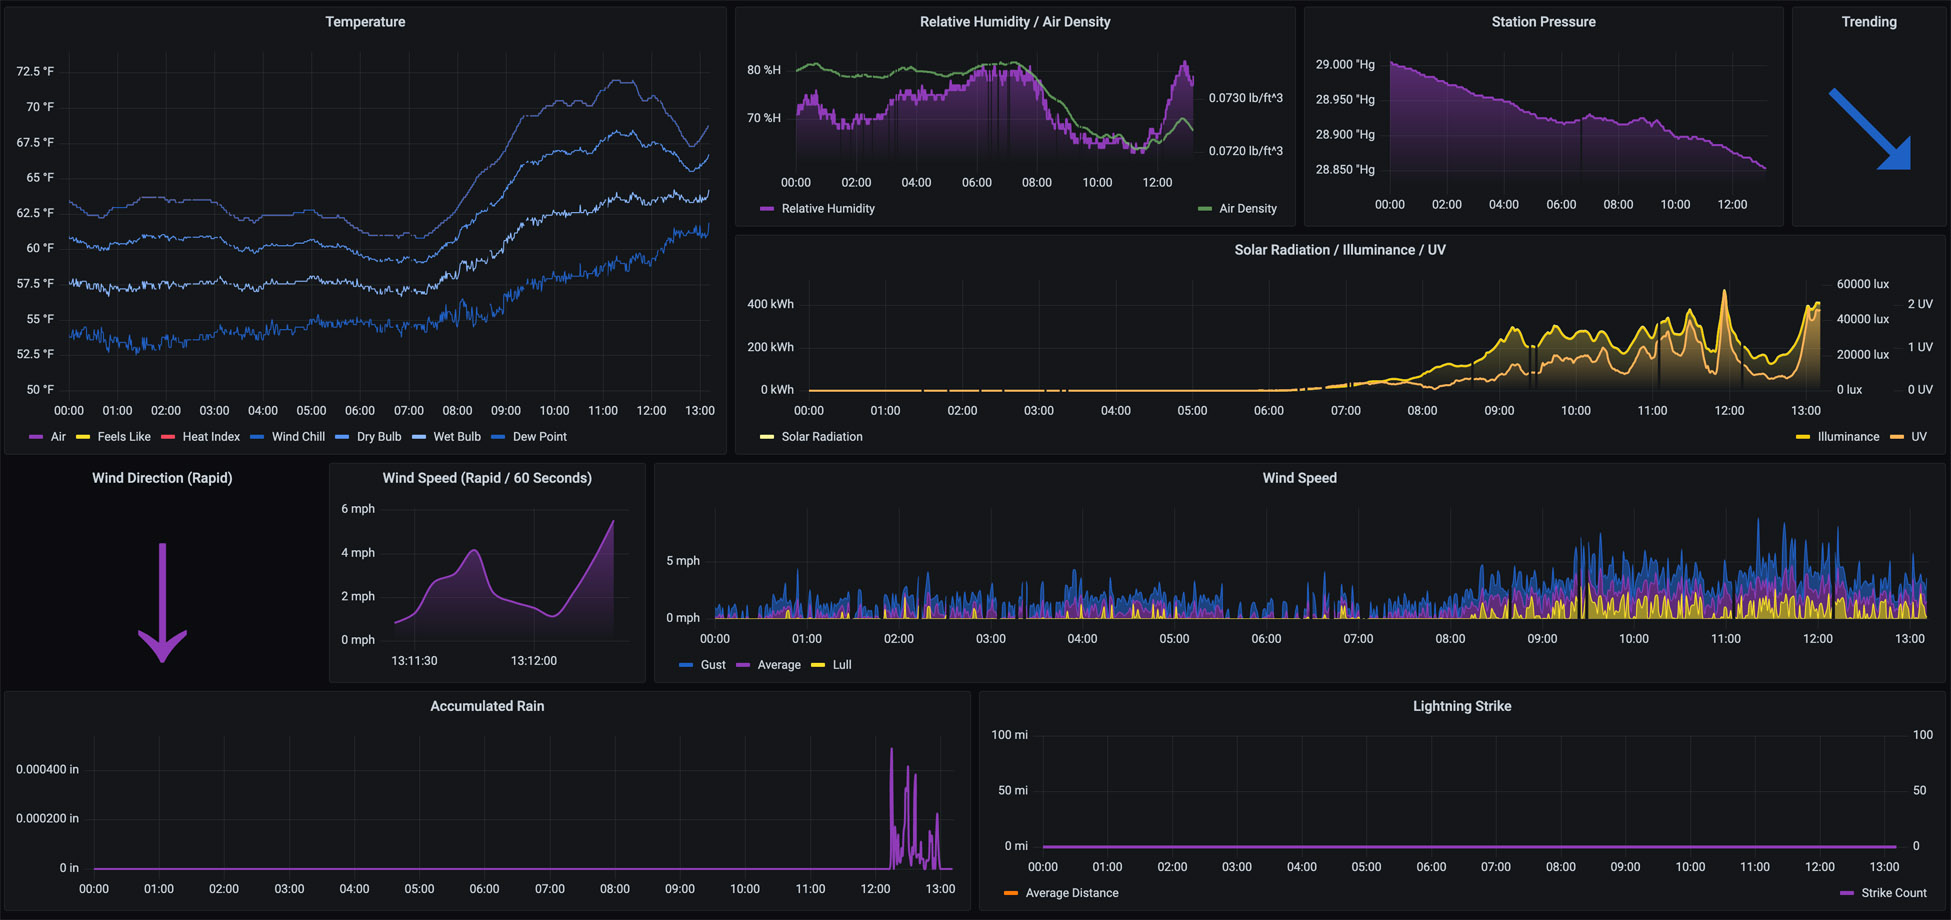
This dashboard provides for the Temperature (Air, Feels Like, Heat Index, Wind Chill, Dry Bulb, Wet Bulb, and Dew Point), Relative Humidity, Air Density, Station Pressure (with Trending), Accumulated Rain, Solar Radiation, Illuminance, UV, Lightning Strike, and Wind Speed from midnight to the current time. These reflect the WeatherFlow measurements from data sent to WeatherFlow and include derived metrics in the response.