I’ll be the first to admit I’ve always been a metrics person. Charts and graphs through and through. Almost to a fault – I largely ignored logs. That’s not to say I haven’t combed through my fair share of application logs across hundreds of endpoints. Do you remember the days of creating shared NAS exports and just writing out logs until they filled up? (Yeah – me neither… ahem…) But recently, two things have come to light in the last few months that make this hopefully an exciting story to tell. One, I discovered Loki, Grafana’s log aggregation system. And two, I have a handful of home lab servers, an increasingly complex network, and storage devices that are hard to see what they’re doing all the time. My initial challenge involved understanding why my wireless devices had intermittent network instability and which (if any) of my wireless access points had the most issues. But all I had to work with was Syslog.
A search on Google for “Syslog Collector” presented me with 342,000 results to start my effort. Most of the attention-grabbing “6 Free Syslog Servers” links turned into a fair number of Windows utilities, but each is still pretty limited to just a few hosts at a time. I needed to collect data from over a dozen systems and run on Linux and MacOS. What I needed was some Open Source goodness.
This now becomes a tale of how I came to love logs.
And Loki. <3
My first exposure to Loki came recently during my first days at Grafana Labs. Presented with a fantastic way to discover and consume logs in relationship to Prometheus and Kubernetes with microservices – it didn’t immediately occur to me to capture standalone network logs with Loki in this same fashion. And so I set out to see what I could accomplish.
Loki is relatively easy to deploy as a single binary via the command line or Docker. One of the primary ways to get logs into Loki is using Promtail, which is also easily deployed the same way. I jumped into docker-compose (even with Loki’s roots coming from Prometheus and Kubernetes – I’m looking to build out essentially a quick start standalone Syslog ingester.)
A look through some of the Loki documentation on configuring Promtail with Syslog had me realize that Promtail only works with IETF Syslog (RFC5424) – which is how I also found out my devices were limited to only RFC3164. Time to look at syslog-ng!!
What’s valuable about syslog-ng in my situation is that it can be spun up to listen for RFC3164 (UDP port 514) and then forward it to Promtail RFC5424 on port 1514. (Many of my devices only output the older style of Syslog…) I needed to do a few quick configurations to get syslog-ng and Promtail talking to each other!
syslog-ng Configuration
# syslog-ng.conf

source s_local {
    internal();
};

source s_network {
    default-network-drivers(
    );
};

destination d_loki {
    syslog("promtail" transport("tcp") port("1514"));
};

log {
        source(s_local);
        source(s_network);
        destination(d_loki);
};
Promtail Configuration
# promtail-config.yml

server:
  http_listen_port: 9080
  grpc_listen_port: 0

positions:
  filename: /tmp/positions.yaml

clients:
  - url: http://loki:3100/loki/api/v1/push

scrape_configs:

- job_name: syslog
  syslog:
    listen_address: 0.0.0.0:1514
    idle_timeout: 60s
    label_structured_data: yes
    labels:
      job: "syslog"
  relabel_configs:
    - source_labels: ['__syslog_message_hostname']
      target_label: 'host'
The relabeling in Promtail takes the hostname of the sending device into syslog-ng and turns it into a host label for Loki to index. Within a few minutes, all of my hosts were streaming Syslog from my network into Loki and explorable within Grafana!
Now – around this same time, Loki 2.0 was released. Ward Bekker had just presented to our team some of the launch efforts and dashboard examples he worked on when I heard him say to me…
“Dave – look how easy it is to turn logs into metrics!” ~ Ward Bekker
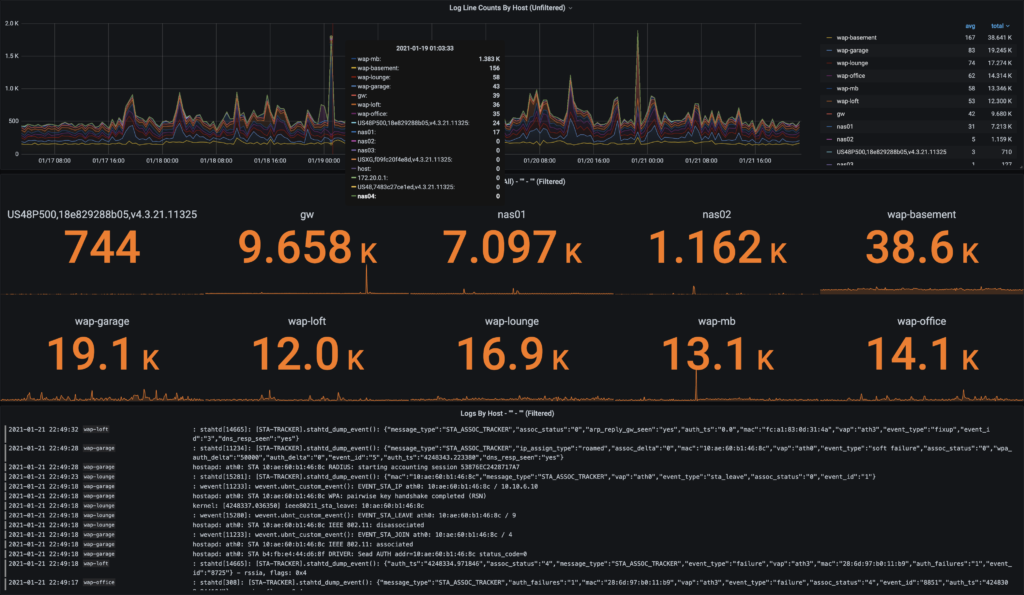
Ward – you have my attention!! At this point, I expedited my efforts to build a dashboard that combined how easy it was to gather my logs into an even easier way to sort, search, filter, and present helpful information with dashboards showing all device logs.
Within a few minutes, I had a working dashboard to configure a drop-down of pre-defined search terms or use a free-form search for items in my logs. Then, I applied the “logs to metrics” magic and presented group summaries of counts by wireless access points!
Oh yeah – my first LogQL query!! Showing the number of logs over time filtered by hostname (host= “$hostname”), coming from my Syslog Promtail job (job= “syslog”), with a free-form search query string from my Grafana variable ($filter).
count_over_time({host=~"$hostname", job="syslog"}[$__interval] |="$filter”)
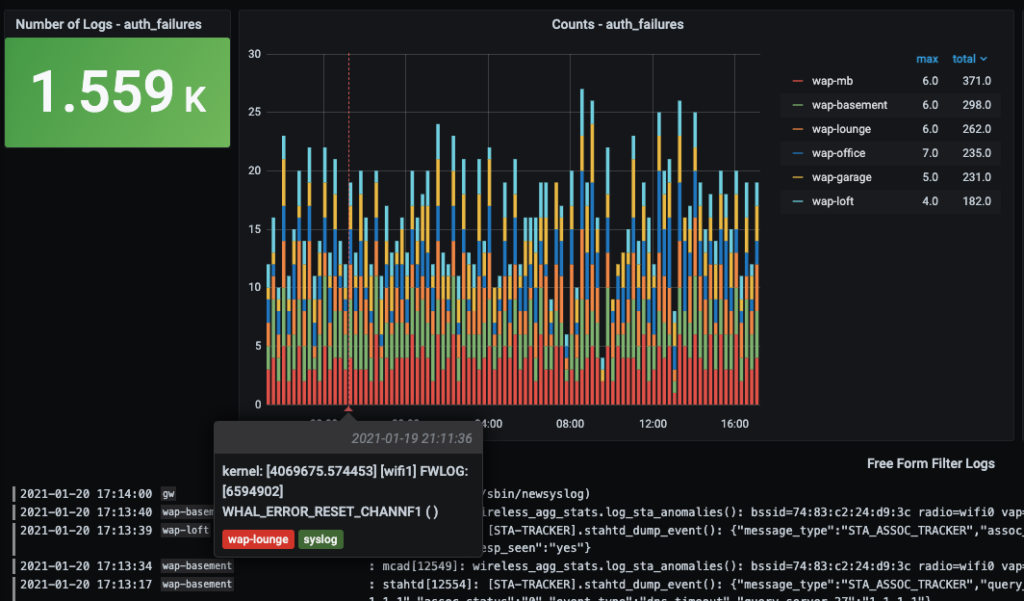
With a bit more dashboard usability tweaking, I could visualize other types of logging from my gateway devices, server IPMI stats, and NAS details – all available to scroll back through time. And finally – building out alerting for threshold breaching (yes… logs into metrics!! More on alerting in a follow-up post.)
So, while a pretty simple example of how I got started with Loki and my logging journey – I believe it represents how quick and easy it is to connect Open Source solutions to solve immediate problems – even in a home lab situation.
I also wanted to share these configurations, and what better way to do that than with a kind of “All In One” docker-compose project? So, I present to you the following:
Grafana Loki Syslog All-In-One Project

This quick example project allows you to run these services with docker-compose on a Linux server. Point your network devices at (hostname:514) and log into Grafana (hostname:3000) and you’ll be presented with the “Loki Syslog AIO – Overview” dashboard. For those of you who want to see some of the behind-the-scenes details, I’ve included some prebuilt performance overview dashboards for each of the primary services (Grafana, Loki, MinIO, Docker, and host metrics.) You’ll see dropdown links to the “Performance Overview” at the top of the Loki Syslog AIO – Overview dashboard, including links to get you back to the starting dashboard. If you don’t have Syslog devices immediately available but want to try the dashboard out – I also built an optional Syslog Generator container.
Check out my Grafana Loki Syslog AIO GitHub repository for more setup details and downloads. My example, Loki Dashboard, is available in Grafana’s Community Dashboards.
And yes – I did figure out that my dropped connections were related to high DHCP retries and too aggressive of settings on my minimum data rate controls. Now I know! Thanks, Loki!!
![]()
Here is the complete config needed, so that syslog-ng does not crash and can use default-network-drivers
@version: 3.29
@include “scl.conf”
source s_local {
internal();
};
source s_network {
default-network-drivers(
);
};
destination d_loki {
syslog(“promtail” transport(“tcp”) port(“1514”));
};
log {
source(s_local);
source(s_network);
destination(d_loki);
};
great post that has inspired me to set this up on my home lab. I loaded your dashboard but in my case, all the hostname are missing in the middle panel. i do see a large numberic number but sometimes says No Data in the that panel but don’t see all the host as the screenshot in your tutorial. any thoughts?
count_over_time({host=~”$host”, job=”syslog”} [$__interval] |~ “$free_form_filter” |~ “$filter”)
I do see all my host on the Log Line Counts By Host (Unfiltered). i also see Logs By Host on the bottom panel.
Thoughts?