This started as a straightforward story with three simple things:
- I love IoT gadgets.
- I love weather gadgets.
- I love charts and graphs.
While perusing online, it’s possible that I stumbled upon a social media advertisement for the WeatherFlow Tempest Weather System (and a 15% off coupon). It’s also entirely possible that I made a quick purchase.
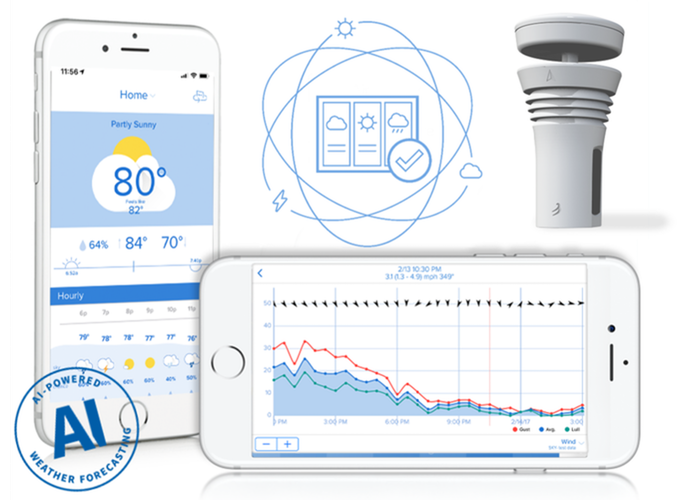
WeatherFlow Tempest started as a Kickstarter project but is now shipping directly outside of just the backers. The WeatherFlow Tempest is a solar-powered weather station that collects measurements of wind, rain, lightning, temperature, humidity, pressure, and sunlight. It has a wireless hub collects these data points, pushes them up to the WeatherFlow cloud for processing and weather forecasting, and then provides a personalized weather app. Data can be collected with a few different APIs – one from WeatherFlow’s processed stream of events and metrics (REST API) or locally via my network with UDP listener API.
Yes. Now we’re talking. APIs. Raw data. Wireless. Weather data. All that means “How can I use my data to make charts and graphs!”
Logs Into Metrics
With any new project – it’s always best to start and see what other great work has already been shared with the community. I found a great InfluxDB listener from Vince Skahan called weatherflow-udp-listener. I made the first set of Grafana dashboards that used his system, which worked well. But as much as I loved Vince’s efforts – the project isn’t currently supported (but should work just fine for the foreseeable future…)
I wanted to work with the raw JSON logs being streamed over UDP from the Tempest to the WeatherFlow hub. I needed a way to collect those JSON logs and push them into a logging system that provides long-term storage AND a way to turn logs into metrics. What better solution than Grafana’s Loki log aggregation system?
JSON Logs
The WeatherFlow hub sends JSON logs broadcast over UDP port 50222 on my local network. Based on the WeatherFlow Tempest UDP Reference, these logs can be broken out by type (among a few other measurements):
obs_st (Observation – Tempest)
{"serial_number":"ST-00028209","type":"obs_st","hub_sn":"HB-00038302","obs":[[1613934241,0.00,1.34,5.45,93,3,988.74,9.39,28.68,7761,0.23,65,0.000000,0,0,0,2.808,1]],"firmware_revision":134}
device_status
{"serial_number":"ST-00028209","type":"device_status","hub_sn":"HB-00038302","timestamp":1613934241,"uptime":1478650,"voltage":2.81,"firmware_revision":134,"rssi":-69,"hub_rssi":-66,"sensor_status":0,"debug":0}
hub_status
{"serial_number":"HB-00038302","type":"hub_status","firmware_revision":"160","uptime":895935,"rssi":-39,"timestamp":1613934260,"reset_flags":"PIN,SFT","seq":89486,"fs":[1,0,15675411,524288],"radio_stats":[25,1,0,3,4248],"mqtt_stats":[119,29]}
rapid_wind
{"serial_number":"ST-00028209","type":"rapid_wind","hub_sn":"HB-00038302","ob":[1613934245,0.67,152]}
Using a slightly modified weatherflow-listener.py script (from P-Doyle’s Simple-WeatherFlow-Python-Listener), I could use the following command to send the broadcast JSON logs into Loki via Promtail.
/usr/bin/stdbuf -oL /usr/bin/python weatherflow-listener.py | /usr/bin/promtail --stdin --client.url http://loki:3100/loki/api/v1/push --client.external-labels=app=weatherflow,hostname=weatherflow
(Using stdbuf here to reduce the STDOUT/STDIN buffer wait…)
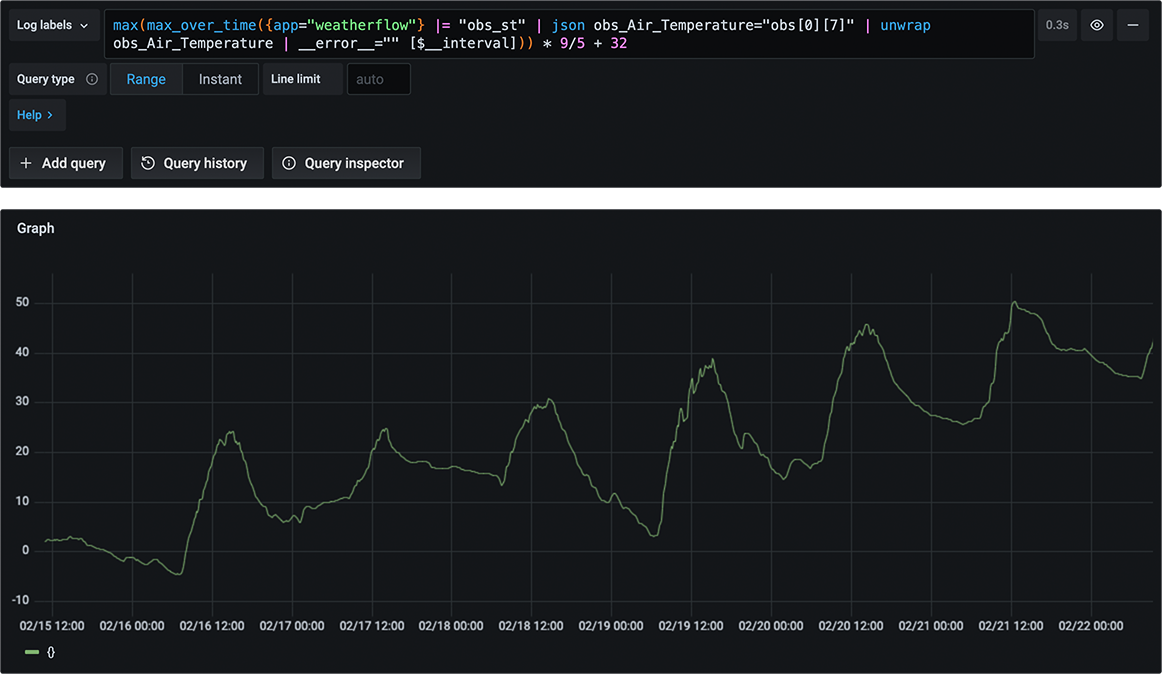
Once the logs are in Grafana Loki – I used Loki’s LogQL to crack open some of the JSON arrays into useful metrics:
max(max_over_time({app="weatherflow"} |= "obs_st" | json obs_Air_Temperature="obs[0][7]" | unwrap obs_Air_Temperature | __error__="" [$__interval])) * 9/5 + 32
Using the WeatherFlow UDP API as a guide, I made metrics from each of the index values:
Observation Value Layout
| Index | Field | Units |
|---|---|---|
| 0 | Time Epoch | Seconds |
| 1 | Wind Lull (minimum 3 second sample) | m/s |
| 2 | Wind Avg (average over report interval) | m/s |
| 3 | Wind Gust (maximum 3 second sample) | m/s |
| 4 | Wind Direction | Degrees |
| 5 | Wind Sample Interval | seconds |
| 6 | Station Pressure | MB |
| 7 | Air Temperature | C |
| 8 | Relative Humidity | % |
| 9 | Illuminance | Lux |
| 10 | UV | Index |
| 11 | Solar Radiation | W/m^2 |
| 12 | Precip Accumulated | mm |
| 13 | Precipitation Type | 0 = none, 1 = rain, 2 = hail |
| 14 | Lightning Strike Avg Distance | km |
| 15 | Lightning Strike Count | |
| 16 | Battery | Volts |
| 17 | Report Interval | Minutes |
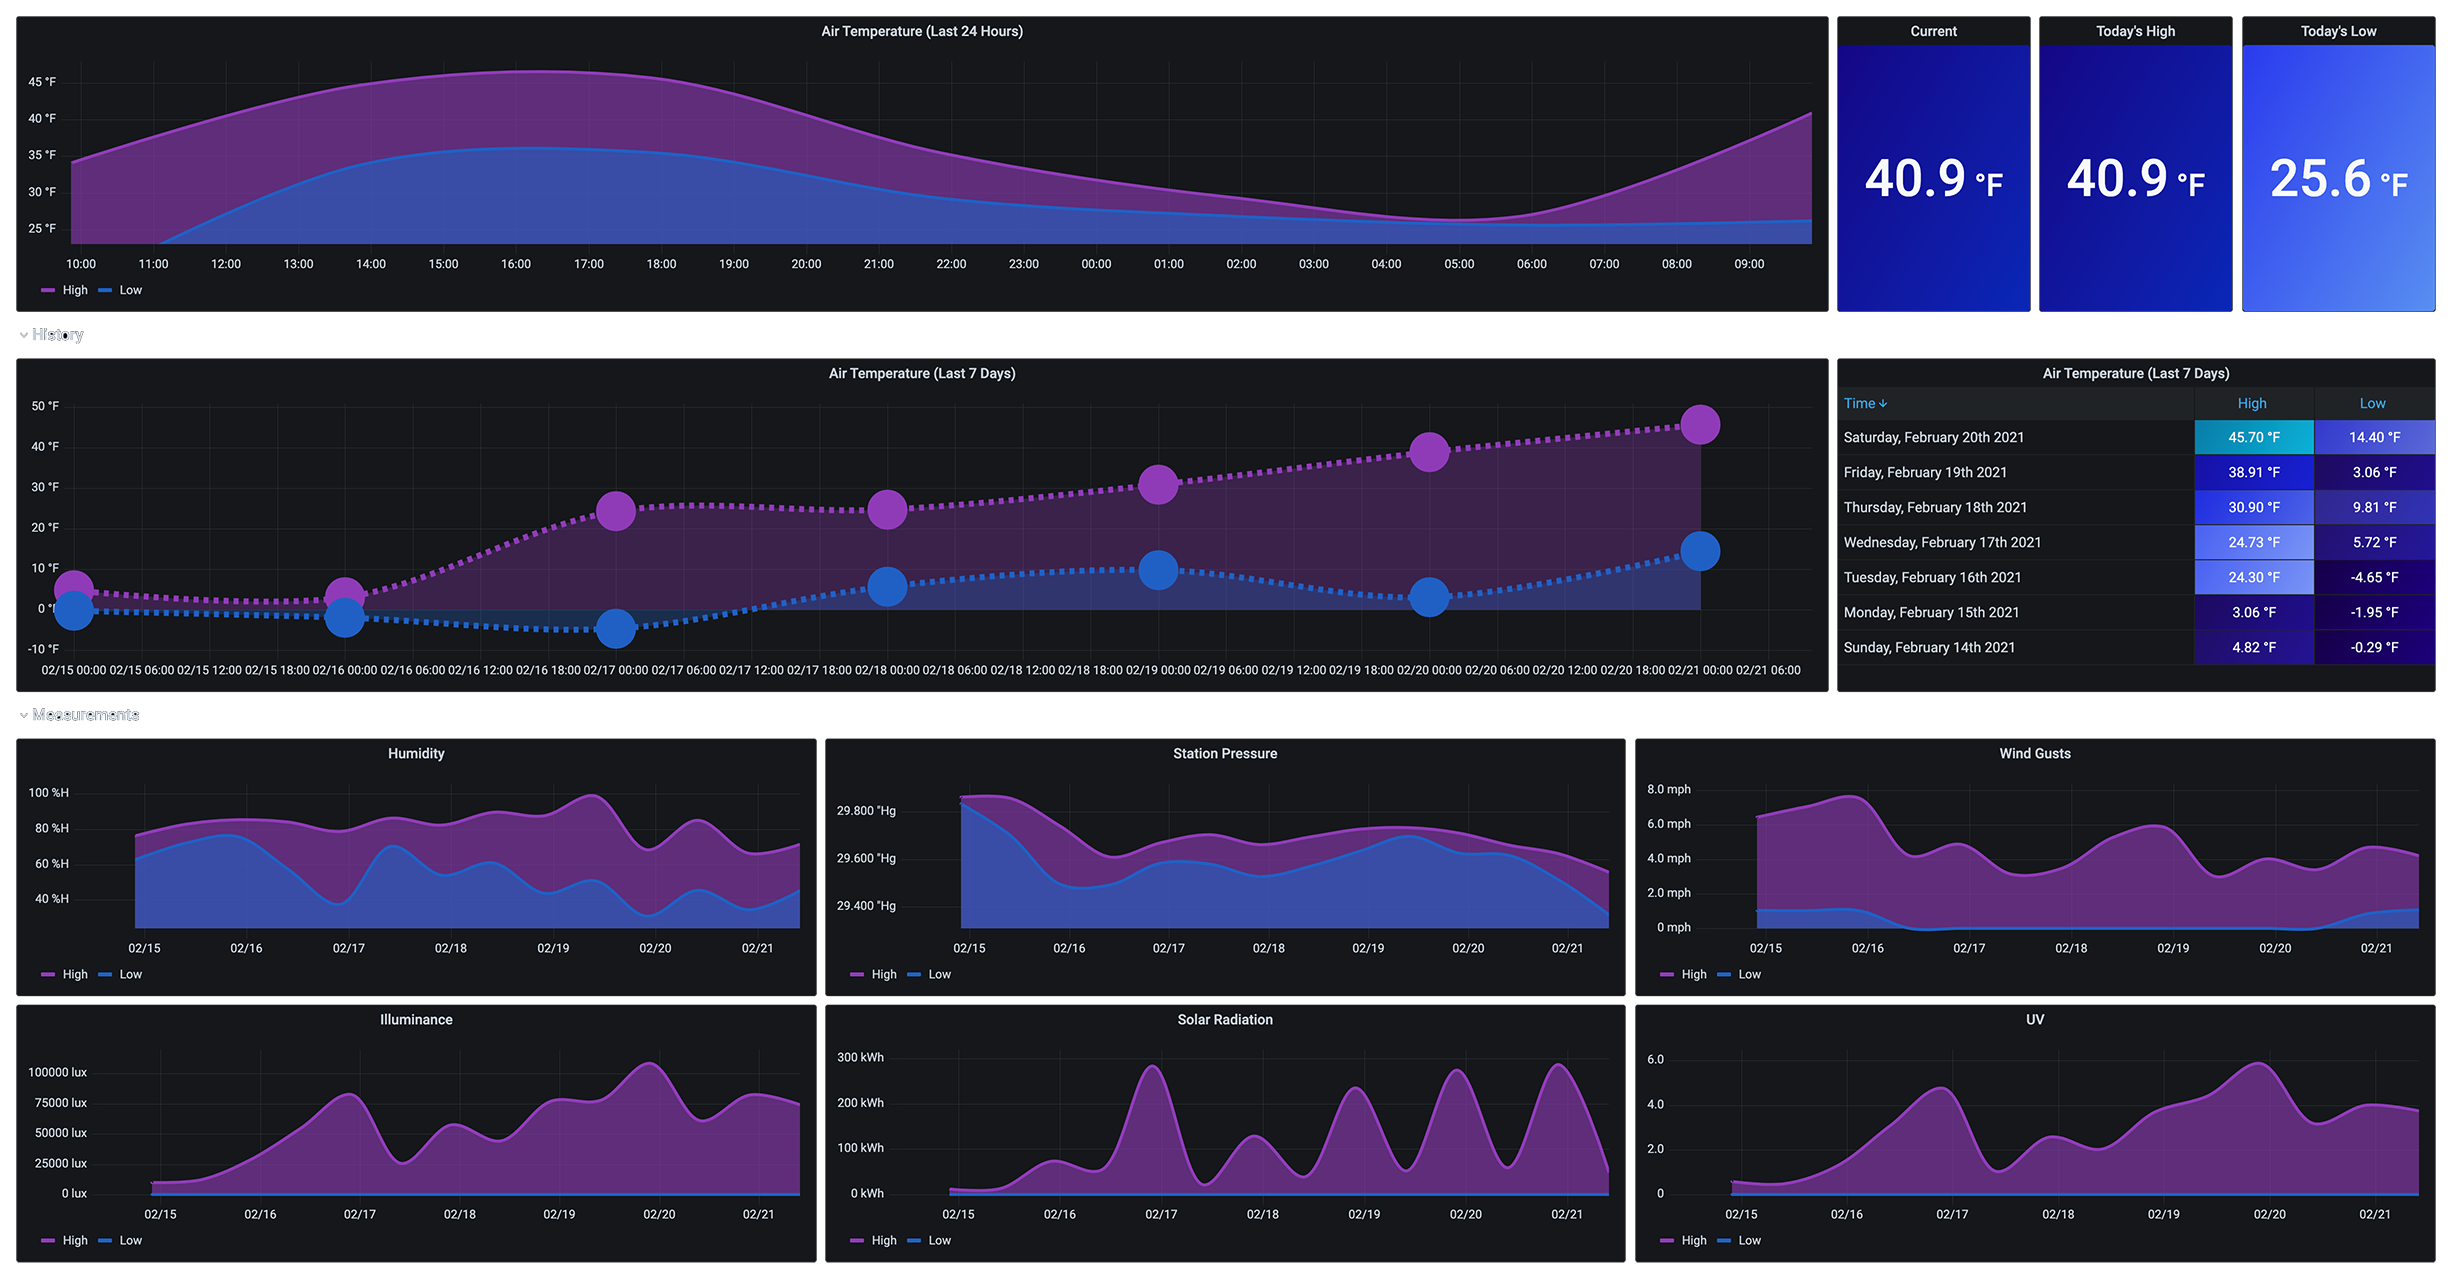
Grafana Dashboards
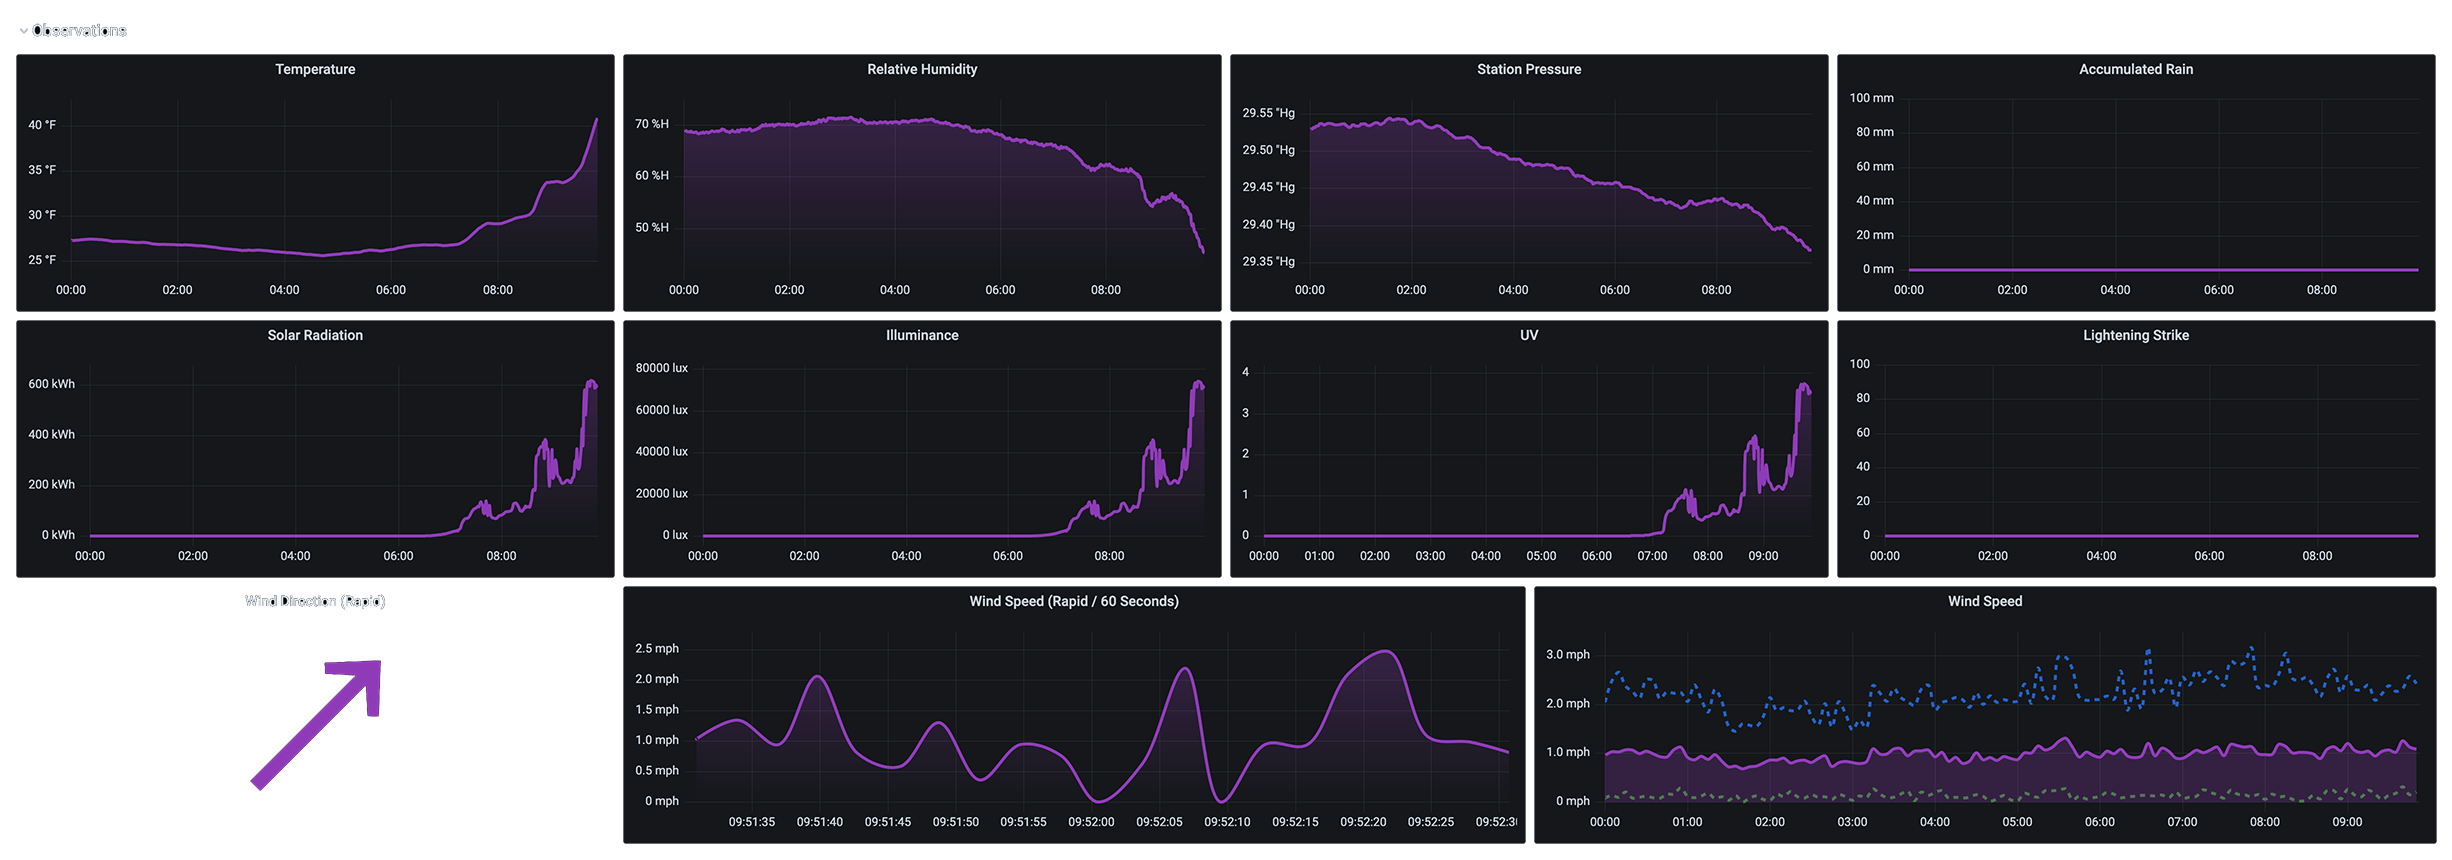
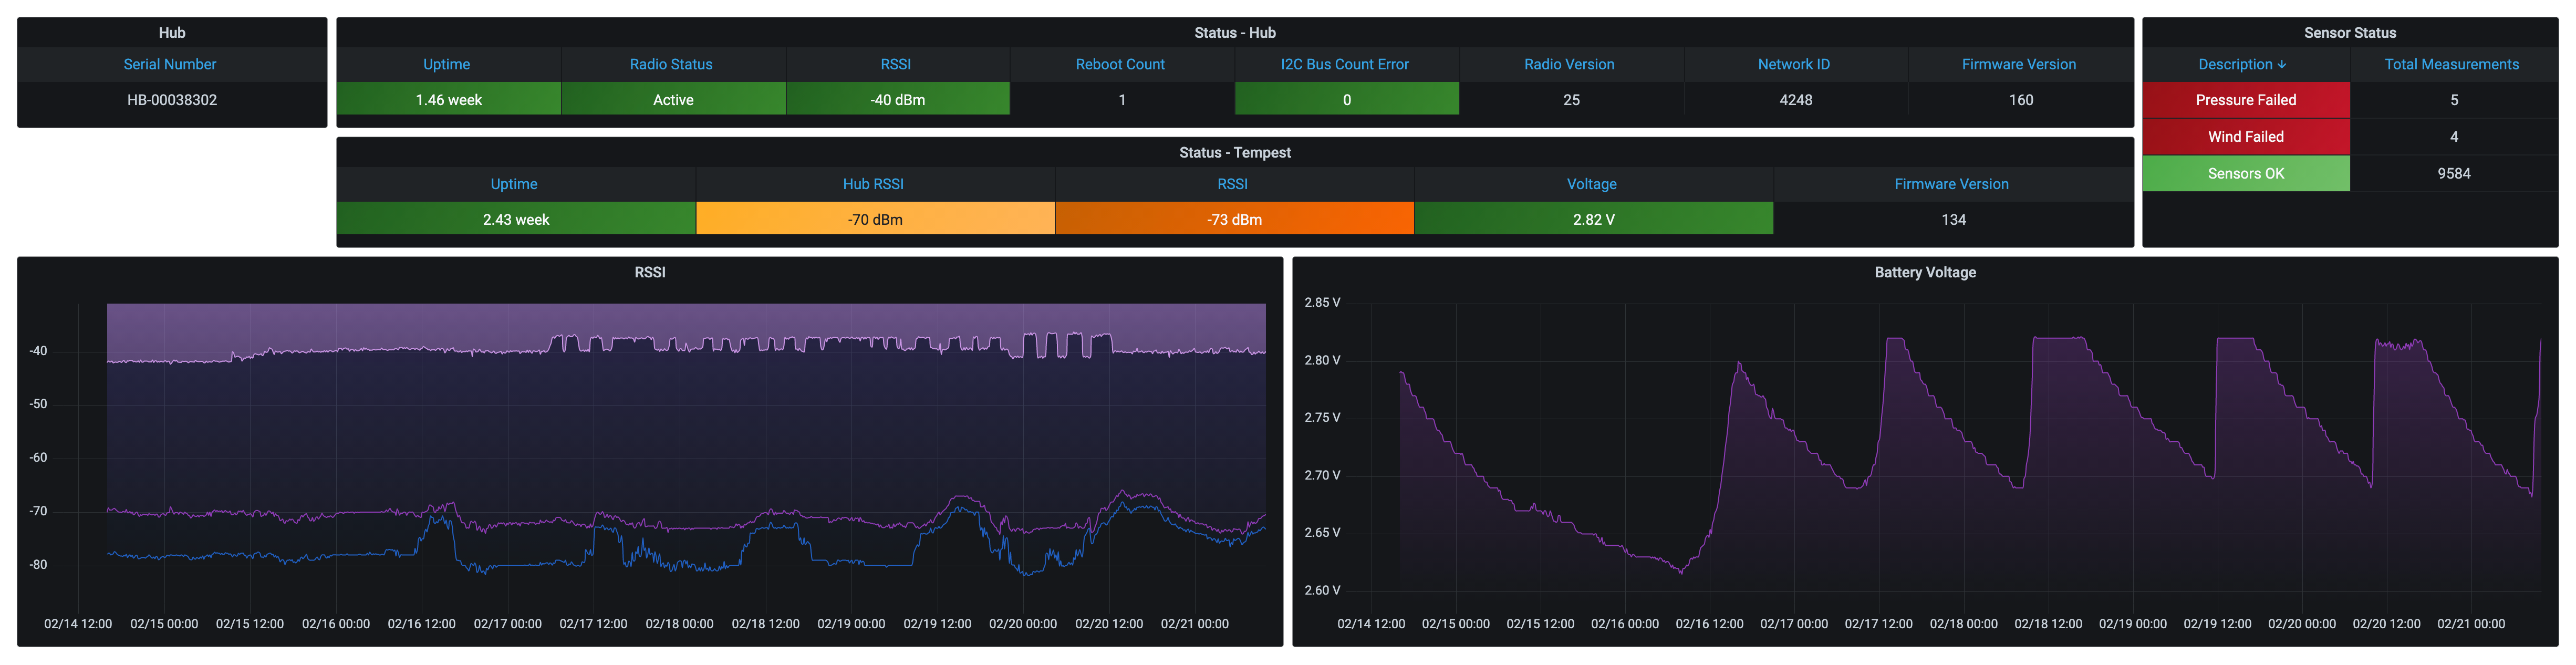
The rest of my efforts were turning those metrics into usable information – coming up with an Overview, Today So Far, and a Device Details set of Grafana dashboards.

Like my previous Loki Syslog All-In-One project – I created an All-In-One project for this WeatherFlow collector. Details on installing your own collector, including all the files needed to download, are over at my WeatherFlow Dashboards AIO Github repository. These dashboards are also available in Grafana’s Community Dashboards. With some help from P-Doyle’s Simple-WeatherFlow-Python-Listener and Promtail – you too can deploy a quick and easy WeatherFlow log collector with Grafana Loki and Grafana dashboards.
If you’re a WeatherFlow fan, I’d love any feedback on how this works. If you’d like to share your dashboards, I’d happily include them here to share with the community!
These dashboards are also part of my Internet-facing set of current Grafana dashboards. Enjoy!!
Is there a dummy’s guide of how to do this for your own tempest for the beginner on this subject. I would love to build this for my system. I know a number of things but need a 1, 2,3 cookbook of what needs to be done from beginning to end. How can I get this information?
Steve – I built out an All In One system that you should be able to take the pieces and update as you please. Head over to my WeatherFlow Dashboards page on Github – https://github.com/lux4rd0/weatherflow-dashboards-aio
I’m looking to also make some small updates to show all of those pieces individually for those that have something like Grafana and Loki deployed without using Docker.
Let me know if you’d like some specific help in your journey and I’d be happy to assist.
Beautiful. Oh, to code, but I use WeatherFlow’s API just to pull precipitation data and post to a Google Sheet. Do I need to water the grass?
Don – thanks for swinging by. I started with the WeatherFlow API to pull in data but the gadget tinkerer in me was really curious about the raw data. My next update is to build out a few more dashboards with the weather data coming * back * from WeatherFlow and make that easy to deploy as well. And yes – always water the grass! (I use a Rachio to help me out with that…)
Awesome work, Dave, thanks for sharing.
Rod – appreciate you coming back and taking a look! Hope to have a few more updates soon as I get more data into my own system.
Thank you so much! The Overview and Today So Far dashboards are exactly what I was looking for!
David – you’re quite welcome! I happy to hear that those dashboards are useful. I’m looking to make a few more dashboards as I play with more of the longer term data. Stay tuned!
Get Ingester not ready message from loki and looks like no weatherflow data get logged. I do get some device status readings and rapid wind readings as well as current temperature.
If I start loki without running dashboards using the following command:
docker run -v :/mnt/config -p 3100:3100 grafana/loki:2.1.0 –config.file=/mnt/config/loki-config.yaml
I get an Ingester ready message from loki.
Running dashboards on Raspberry Pi 3 under Raspbian Buster.
Any suggestions on troubleshooting would be appreciated.
Fred – thanks for asking some questions about your system. Are you using a Tempest or one of the other WeatherFlow devices? You’re seeing some of the data but not all of it which I’ve heard from a few other people that they have the Air and Sky and those have different JSON data structures. I have some sample logs that I’m going to work on building out other dashboards for those since I don’t have those devices myself.
The Loki ingester errors – can you share those? I don’t have a Pi but I should be able to help sort those out. I can send you an e-mail if you like and we can troubleshoot together. Thanks!
Fred – I picked up a Raspberry Pi today to test this build out. Two things looked a little different that may be your fix. First – when starting up the Loki container – it creates a “loki” directory under /data – but it’s owned by root. Make sure that all of the directories are owned by Pi:Pi (1000:1000). I’ve updated my project to include that empty directory so it should work fine for new pulls. Secondly, there was a Loki issue with the grafana/loki:latest that was having issues running on 32-bit ARM OSs. For now you can edit the docker-compose.yml to read grafana/loki:master-2dbdbee instead of latest. Try out those two changes and let me know if you start seeing better data. Once those changes get pushed to a Loki release, I’ll update my project as well. Thanks!
Thanks Dave. I am using the Tempest device and getting good udp data translation from it. Going to retry this using your suggestions and a fresh install on the rpi. (Took a break to work on taxes, ugh!) Will let you know the results.
Splendid charts, Dave! All appears to be working well on my Raspberry Pi 3 Model B Rev 1.2 running Raspbian GNU/Linux 10 (buster). I verified Loki and promtail were working together before running your up.sh script. When started from your script, Loki was not finding your config file but was looking for one in /etc/loki. cp weatherflow-dashboards-aio-1.02/config/loki-config.yml /etc/loki/ took care of that and my charts started populating with Tempest data.
Sometime I hope to move to the new PI OS, but I am glad Raspbian Buster is compatible.
PS Other Raspbian Buster users will find Docker installs easily but Docker-compose appears as a stumbling block since the Docker intall scripts aren’t compatible. PIP is the answer.
install via pip – https://dev.to/rohansawant/installing-docker-and-docker-compose-on-the-raspberry-pi-in-5-simple-steps-3mgl
sudo apt-get install -y libffi-dev libssl-dev
sudo apt-get install -y python3 python3-pip
sudo apt-get remove python-configparser
sudo pip3 -v install docker-compose
Thanks so much for doing this. I have been looking for something like this for a while.
Spent about 2 hours trying to get it working to no success as yet.
Not sure how to set the UID.
The command ‘export UID_GID=”$(id -u):$(id -g)”‘ does nothing. So I added ‘echo’ to the front to find my UID.
Once I found that, I was able to edit the up, stop, down scrips as you suggest.
Had to launch them with sudo as doing it as a user fails due to permission issues.
Once running, I can view the Grafana dashboard, but there is no data. On each graph there is a red mark with ‘bad gateway’.
Also in the doc the weatherflow device is mentioned to be on UDP port 50022, but the yml file as the correct port of 50222.
When starting the docker, I get the following:
sudo docker-compose -f docker-compose.yml up -d
WARNING: The UID_GID variable is not set. Defaulting to a blank string.
Creating network “weatherflow-dashboards-aio-102_wxflowaio” with the default driver
Creating loki … done
Creating grafana … done
Creating weatherflow-listener … done
I know my weatherflow device is on UDP port 50222 as my Node-RED can see the data.
Any help you can offer to get the data to show would be greatly appreciated.
Thanks.
Hello! And thanks for spending some time trying to make this work. My hope was that for most, simply running the docker-compose and/or up.sh commands would just “work”. But what I’ve seen is the permissions for running the containers tend to get messy. What I suspect is that Loki is trying to start up but doesn’t like the permissions where the data files are being created and/or written. If you start the script up without the proper UID/GID the first time – that
/data/lokigets created as root or doesn’t get created at all. You may need to manually change the docker-compose.yml file to reflect the actual numbers of the user ID that you’re running as. The “WARNING: The UID_GID variable is not set” would explain some of those errors. In the Loki stanza in the docker-compose.yml, can you change theuser: "${UID_GID}"to something likeuser: "0:0"(if you’re root) or whatever you actual user/group permissions on the file system are? Can you also share what OS/system you’re trying to run it on? You can also (for sake of testing) comment out the" - ./data/loki:/tmp/loki:rw"anduserto see if Loki starts up. I have that volume mount external to the container so that you don’t lose the data if you “down” the container. Lastly – thanks for the 50022/50222 typo. I updated it!Dave, thanks so much for your help…. I now see a little bit of data!!!
Using the ‘echo’ command, I know my UID and so added that to the yml as you said and it started with no errors.
The odd thing now is that I see device detail data, the RSSI and battery voltage graph is filling out as is the status for the hub and Tempest, but all other dashboards are blank with a simple ‘No data found in response’… My guess? WeatherFlow changed the UDP data format at some stage/firmware version and so the data collector is not seeing my data.
Update.
I am seeing battery voltage and RSSI and also Wind Direction (Rapid) and Wind Speed (Rapid / 60 Seconds). All other graphs are blank.
I see all the data in my Node-RED and also on the WeatherFlow forums Raspberry Pi 7 inch touch screen project.
Can you point me in the direction where Loki ingest is looking for the JSON data? I would like to get this going, but am not sure where the data is decoded from the WeatherFlow UDP stream.
Nice! Do you have Tempest or the Air & Sky? I just made updates to allow both to be seen. Like literally a few minutes ago. You can see the changes in v1.03 or you can grab the individual dashboard files. You can see the two files here: https://github.com/lux4rd0/weatherflow-dashboards-aio/tree/main/config/grafana/dashboards/weatherflow. If you do have a Tempest and it’s still not showing – certainly get back with me and we’ll troubleshoot it.
Dave, thanks so much! We are up and running.
The only empty graph is Humidity…. Any pointers where I can look to add that? (I know my station has it, I can see it in the JSON stream).
BTW, your update was perfect, I don’t have a Tempest so was a bit worried it was no do-able, but your new version works great.
Two more questions for you Dave.
The stop.sh and down.sh scripts appear to be the same. For stop.sh, shouldn’t the last line read docker-compose stop instead of docker-compose down?
How do I decrease the log level for the json.logs? Have one that grows quite large day by day. I believe the log level is set to info, but am unsure which configuration file might set it to warn or perhaps stop logging altogether.
Fred – you’re absolutely right – a typo in those up/down/stop scripts. As for the logs – are you talking about the JSON logs that are stored in Loki or a different one? I’m actually rebuilding the All In One now that I’ve added forecasts to it. With that effort, I’ve added better debug/info logging in general to the collectors.
hi,
thanks for the docker container! I installed it on a synology and the interface goes up but without data. However I have some questions! Where and how do I enter the data for my Tempest weather station?
If I have understood correctly, the udp listener must be told where it should pick up the data.
Sorry something clueless, since I have never worked with docker.